As a sales manager, your ability to track performance, identify trends, and make data-driven decisions can directly impact your team’s results. You’ve probably already discovered that HubSpot offers a wide range of reporting tools to help you monitor sales activities, assess team performance, and analyze key metrics. But while these tools are powerful, using them effectively requires more than just pulling standard reports.
The right reporting strategies can help you:
- Pinpoint bottlenecks in your sales pipeline
- Optimize team performance by tracking key metrics like deal velocity and closed revenue
- Align your team’s efforts with broader business goals by tracking progress against targets
- Make better decisions by combining data from multiple sources
But just using HubSpot’s reporting tools isn’t enough on its own. To really get useful insights, you need to know how to customize, filter, and automate your reports so they’re giving you the information you need.
The following tips will help you unlock the full potential of HubSpot reporting, keeping your sales team on track and performing at its best.
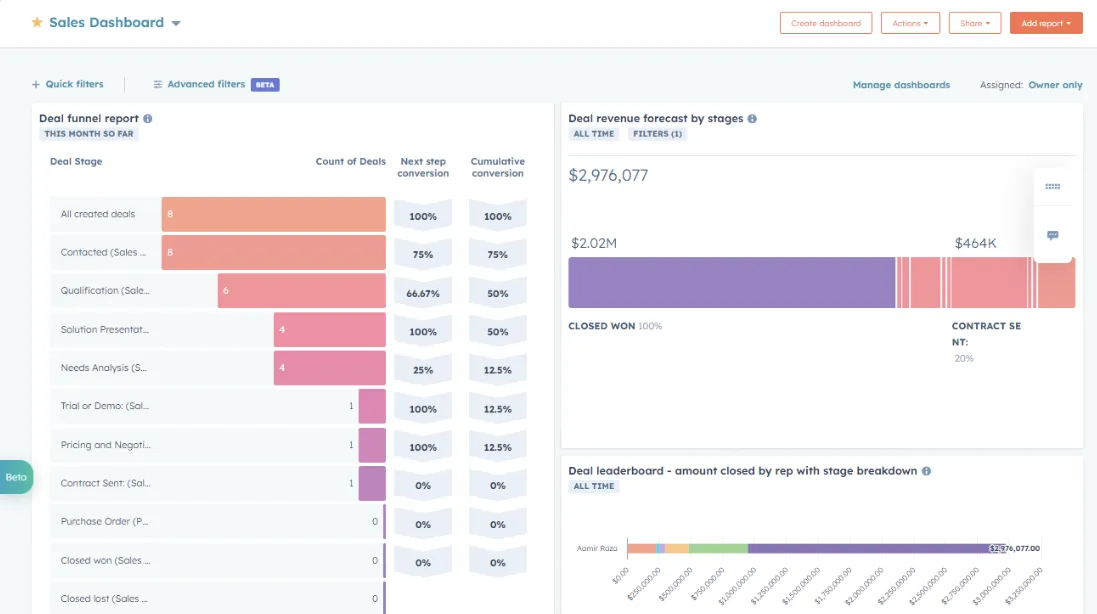
1. Customize your reports for clear insights
Every sales process is different, and HubSpot’s ability to create custom reports ensures that you can focus on what matters most. Instead of relying on generic, pre-built reports, take the time to tailor them specifically for your business needs.
Here’s how to customize effectively:
- Start with your key metrics: Identify the core metrics you need to track, such as sales pipeline stages, closed deals, revenue by source, or individual rep performance.
- Use HubSpot’s drag-and-drop report builder: This tool allows you to add and remove data fields, apply filters, and build reports that give you the insights you need.
- Group and segment data: For example, you can create reports that group deals by region, industry, or sales rep, giving you better visibility into performance differences across segments.
- Visualize with charts: HubSpot offers a variety of chart types, such as bar, line, pie, and others. Pick the chart type that best represents the data, making it easier for you and your team to interpret the information quickly.
Customization example: If tracking revenue by industry is a priority for your business, you could create a report that filters your closed deals by industry, displays the average deal size, and shows the win rate for each sector.
2. Use filters to get specific data
Not all sales data is useful in every context. Filters help you drill down to the specific information that matters most. With HubSpot’s filters, you can create reports that focus on particular aspects of your pipeline, teams, or time frames.
To make the most of filters:
- Focus on a specific time period: Use date range filters to review performance over a specific quarter or fiscal year. This is especially helpful for tracking progress against quarterly targets.
- Isolate specific deal types: Want to know how enterprise deals are progressing versus smaller deals? Set up filters that segment the data by deal size or deal type.
- Narrow down by team or individual: If you manage multiple sales teams or territories, create reports that filter performance by team or rep. This way, you can assess the success of different groups.
Filter example: You can set a filter for ‘Deal Stage’ to see how many deals are in the ‘Negotiation’ stage for each sales rep, allowing you to target coaching efforts where deals tend to stall.
3. Track deal velocity to optimize your pipeline
Deal velocity is a critical metric that tells you how fast deals move through your sales pipeline. A slow pipeline could indicate bottlenecks or inefficiencies, while a fast-moving pipeline suggests high sales efficiency. HubSpot allows you to track deal velocity through custom reports, giving you insight into your sales cycle.
To optimize deal velocity:
- Create a deal velocity report: Set up a report that tracks the average number of days deals spend in each pipeline stage. Compare this to your target velocity to identify potential delays.
- Segment by deal type or size: Larger deals may naturally take longer to close, but identifying the stages where they slow down can help you streamline the process.
- Implement follow-up actions: If you notice deals getting stuck in a certain stage (like ‘Proposal Sent’), set automated reminders or tasks for your sales team to follow up.
Deal velocity example: A report showing that deals are spending too much time in the ‘Negotiation’ phase could prompt you to coach reps on how to handle objections faster, ultimately speeding up the process.
4. Set up goal tracking to monitor performance
HubSpot’s goal tracking feature lets you monitor how well your team is performing against set targets. Whether it's for revenue, deal closures, or activity levels, setting up goals in HubSpot allows you to see real-time progress and keep everyone aligned.
To set up goal tracking:
- Define your sales goals: These could be related to revenue, the number of closed deals, or even activities like the number of calls or emails sent by your team.
- Create goals in HubSpot: Navigate to the ‘Sales Tools’ section in HubSpot, and under ‘Goals’, set measurable, time-bound objectives. For example, you can set a quarterly revenue goal of $500,000 for your team.
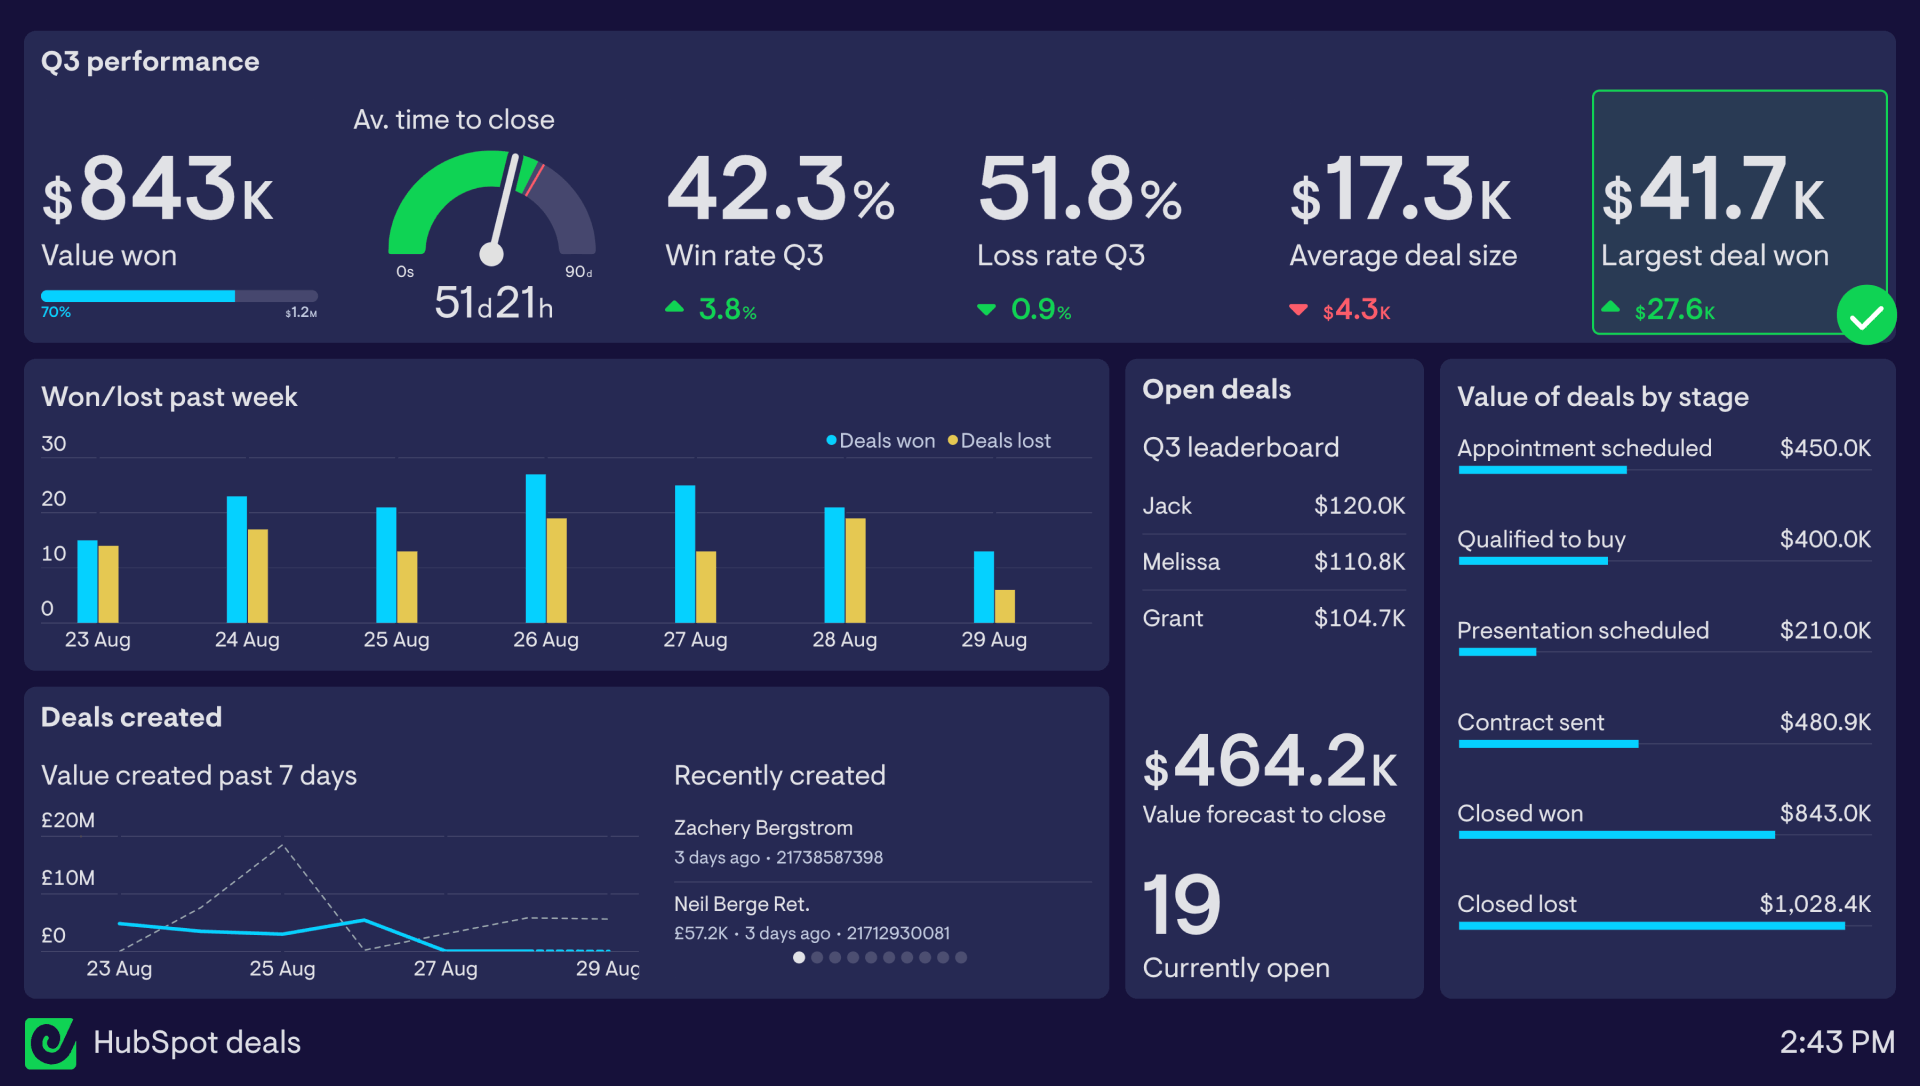
- Track goal progress on dashboards: HubSpot lets you create dashboard widgets that track real-time progress against goals. These widgets show how close your team is to hitting the target, both individually and collectively.
Goal tracking example: Set up a dashboard that shows your team’s performance toward their monthly call and deal closure targets. This helps you monitor which reps are hitting their goals and which might need additional coaching.
5. Automate report scheduling
You don’t need to log into HubSpot every time you want to check a report. HubSpot allows you to automate the delivery of reports directly to your inbox or your team’s, saving time and ensuring consistent updates.
How to automate report scheduling:
- Choose your report: Any report you build in HubSpot can be scheduled for regular updates.
- Set the frequency: Decide whether you want the report delivered daily, weekly, or monthly. A weekly revenue summary, for instance, can keep you updated on your sales team’s progress without constant manual checking.
- Pick recipients: Choose who should receive the report. You can send it to yourself, the entire sales team, or specific individuals.
Automation example: You can automate the delivery of your ‘Pipeline Overview’ report every Monday morning, so your sales team starts the week with a clear picture of what’s in progress and where they need to focus.
6. Use tools alongside HubSpot for multi-source reporting
While HubSpot’s reporting tools are powerful for tracking your sales data, many sales managers need to pull information from other platforms to get a full picture of performance. Whether you’re working with customer support data from Zendesk or marketing insights from Google Analytics, HubSpot alone may not be able to provide everything you need.
This is where using a tool like Geckoboard alongside HubSpot can make a big difference:
- Multi-source integrations: Geckoboard allows you to integrate data from various platforms like Zendesk, Google Sheets, and Salesforce, and visualize everything in one place. This gives you a more comprehensive view of your business beyond what HubSpot alone can offer.
- Real-time dashboards: Unlike HubSpot, which updates reports every few minutes, Geckoboard gives real-time data updates, so you can keep an eye on critical metrics as they change.
- Customizable dashboards: Geckoboard’s intuitive interface lets you create visual, easy-to-understand dashboards that can be displayed on office screens or accessed remotely by your team. This can be especially helpful for sharing live sales data with the broader organization.
Try a free trial of Geckoboard so you can overcome the limitations of relying on a single platform and get a more complete, real-time understanding of your business.
7. Regularly review and update your reports
Sales processes are constantly evolving, so it’s important to review and update your reports regularly to ensure they still align with your team’s goals and workflow. Stale reports with outdated metrics or irrelevant KPIs won’t give you the insights you need to drive performance.
Here’s how to keep your reports relevant:
- Schedule quarterly reviews: At least once a quarter, revisit your existing reports. Are they still aligned with your business goals? Are there new KPIs you should be tracking?
- Keep your team involved: Ask your sales reps for feedback on what metrics they find most helpful, and update reports accordingly.
- Adjust KPIs as needed: As your team’s goals shift, so should your KPIs. Make sure your reports reflect your current priorities, such as focusing more on lead generation or pipeline velocity, depending on what’s most important for your business at the time.
Review example: If your focus shifts from closing deals to generating new leads, adjust your reports to prioritize metrics like the number of new leads, lead sources, and conversion rates.
Take control of your sales data
By following these detailed tips, you’ll not only get the most out of HubSpot’s reporting features but also ensure your reports are delivering the insights you need to drive your sales strategy. Whether it’s customizing reports, tracking deal velocity, or integrating data with tools like Geckoboard, these strategies will help you stay informed, agile, and ready to hit your targets.
