Sales managers often face the challenge of tracking key performance metrics and keeping their teams aligned with sales goals. HubSpot dashboards are a powerful tool to help streamline this process, making the sales pipeline more visible to everyone that needs to see it.
Whether you’re new to HubSpot or you’re just looking for a few tips, understanding how dashboards work can transform the way you manage sales performance. In this guide, we’ll explore everything from setting up your first dashboard to understanding its limitations.
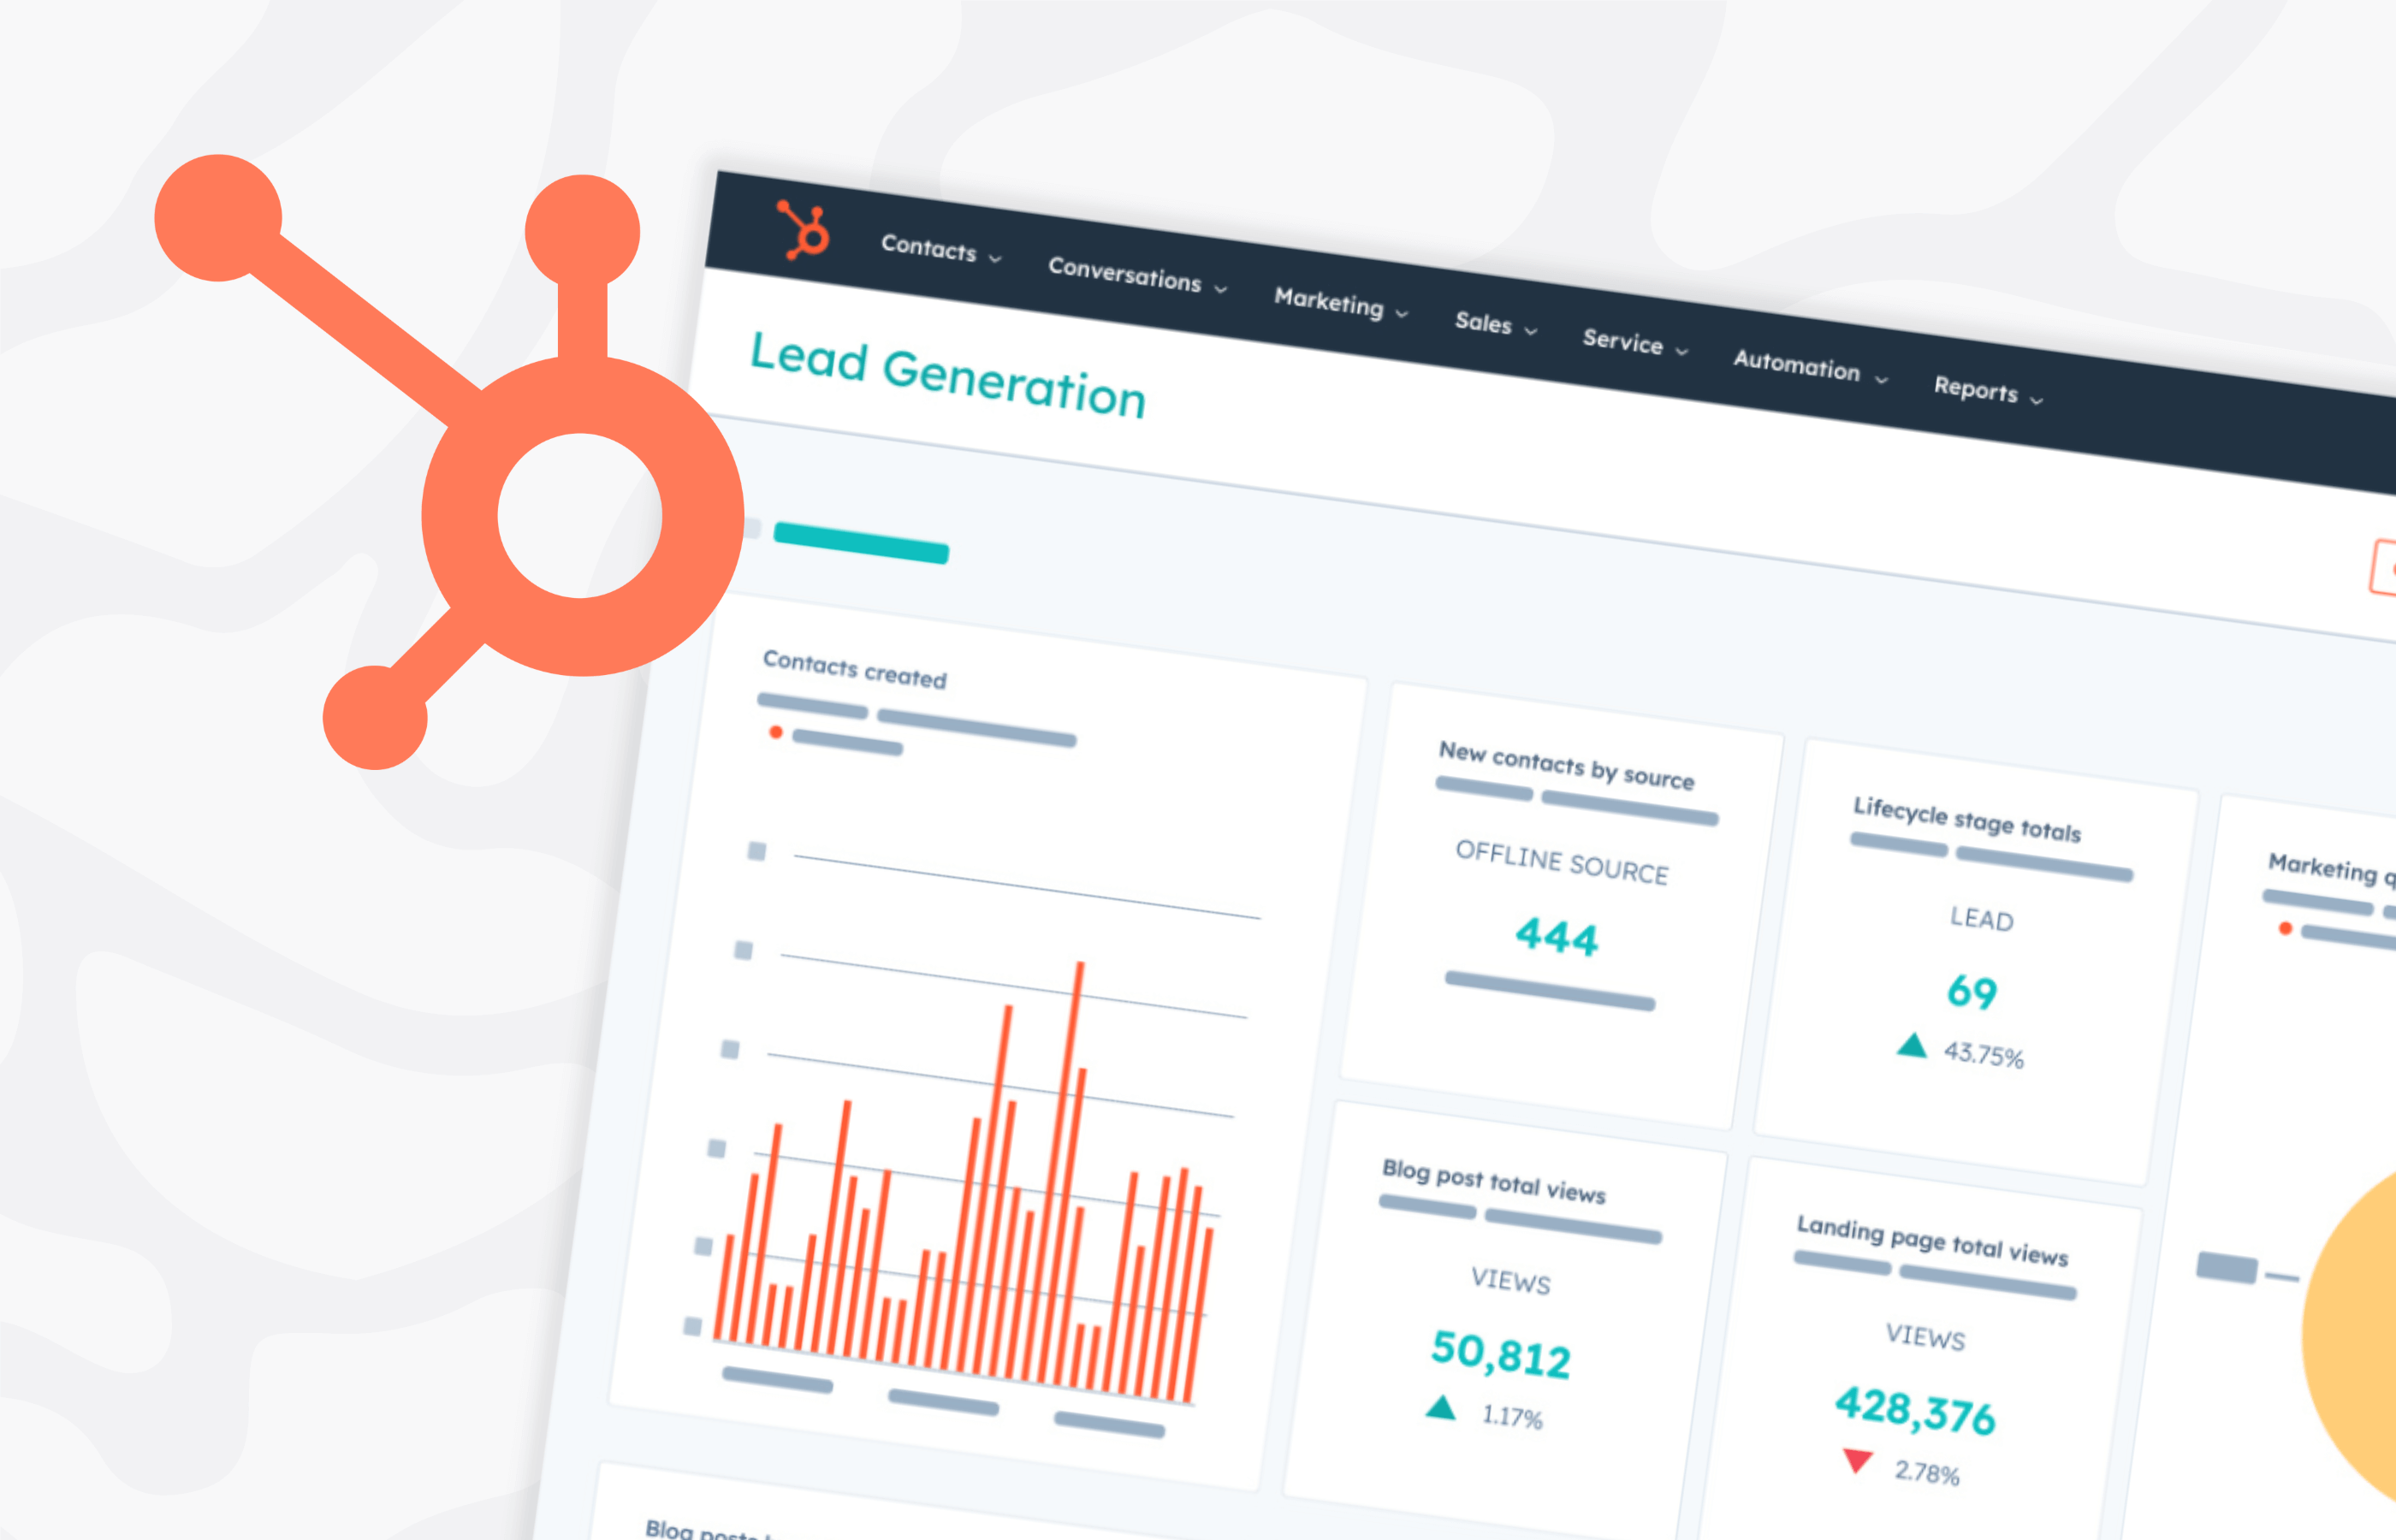
What is a HubSpot dashboard?
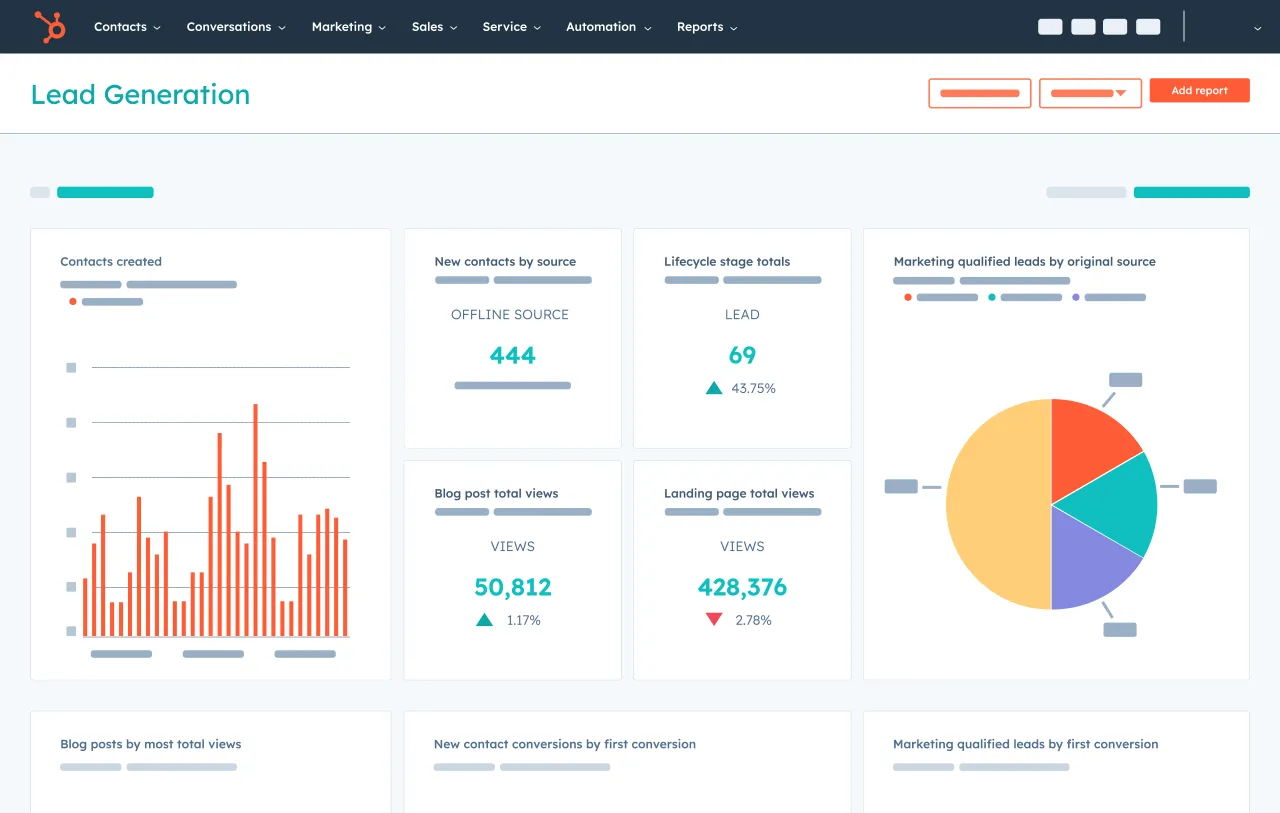
A HubSpot dashboard is a customizable, visual interface that gives you an overview of key sales data. It consolidates reports and metrics into one place, allowing you to track everything from deal progress to revenue goals with ease.
Unlike standalone reports, which focus on specific data sets, dashboards bring together multiple reports into a single view, helping you keep a finger on the pulse of your sales activities at all times.
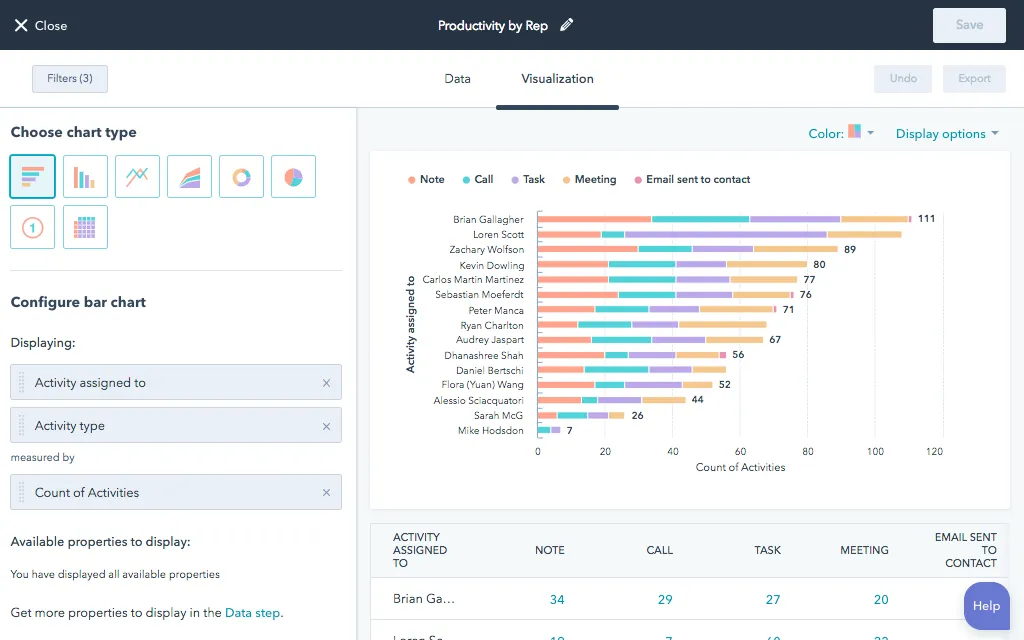
How is a HubSpot dashboard different from a report?
While both dashboards and reports provide valuable insights, they serve distinct purposes. Reports are designed for deeper analysis of specific data points, while dashboards present a broader, real-time overview of various metrics. This makes dashboards ideal for day-to-day tracking, while reports offer more detailed insight into specific areas.
Here’s a clearer breakdown of the differences between the two:
- Reports: Offer in-depth, granular analysis of particular metrics or areas of the sales process.
- Dashboards: Provide a broad overview of several metrics at once, helping you track general progress quickly.
What are the benefits of setting up HubSpot dashboards?
A well-structured HubSpot dashboard can transform how your sales team operates. By pulling all essential metrics into one place, it simplifies tracking KPIs and provides your team with a visual way to stay on top of their goals.
Key benefits of using HubSpot dashboards include:
- Centralized data: Keep all your important sales data in one place for quick access.
- Customization: Tailor dashboards to your team’s specific needs, displaying relevant reports and data.
- Frequent updates: HubSpot dashboards refresh every 5–10 minutes, giving you nearly up-to-date information.
- Goal tracking: Easily monitor progress toward sales quotas, revenue targets, and deal stages.
What are the limitations of HubSpot dashboards?
While HubSpot dashboards can be a lifeline for sales teams, they do have limitations that are worth considering. For teams needing real-time data or the ability to integrate information from multiple platforms, there are other solutions to help.
Here are some of the limitations that users might experience:
- Plan limitations: Dashboards are not available on HubSpot’s Starter plan, limiting access for smaller teams.
- Data isn’t real-time: HubSpot dashboards refresh every 5-10 minutes but don’t provide live, real-time updates.
- No office display: HubSpot doesn’t support using dashboards on TV displays for team-wide visibility in an office setting.
- Data from multiple sources: HubSpot struggles to integrate data from external sources like Zendesk, Aircall, or Google Sheets, limiting your ability to combine data from different platforms.
If your team needs real-time data or broader integrations, Geckoboard offers an excellent addition to HubSpot. It integrates with various data sources and provides true real-time updates, perfect for displaying live data on office screens or combining information from multiple platforms.
Getting started with HubSpot dashboards
Setting up your first HubSpot sales dashboard is straightforward, thanks to customizable templates and easy-to-use drag-and-drop functionality. Follow these steps to get started:
- Navigate to dashboards: From your HubSpot account, go to the main menu on the top navigation bar. Hover over ‘Reports’ and click ‘Dashboards’ from the dropdown.
- Create a new dashboard: On the ‘Dashboard’ page, click the ‘Create Dashboard’ button in the top-right corner.
- Choose a template: HubSpot provides several pre-built templates tailored to different business needs. Some popular templates include: Sales Dashboard, Marketing Dashboard, Revenue Leaderboard, and Sales Pipeline Overview. You can choose a template or start from scratch by selecting ‘Blank Dashboard’.
- Name your dashboard: After selecting a template (or choosing to create a blank one), give your dashboard a descriptive name that reflects its purpose (e.g., ‘Sales Performance Dashboard’ or ‘Lead Tracking Dashboard’).
- Customize your dashboard: Now, you can start adding reports or widgets to your dashboard. If you chose a template, some reports will already be populated, but you can adjust or remove them as needed. To add new reports, click the ‘Add Report’ button and either choose from existing reports in your account or create new ones. Drag and drop the reports into the layout that works best for your team.
- Set filters and permissions: Customize your filters based on the data you want to display (e.g., time period, sales rep, deal stage). Set permissions to ensure only the right team members have access to view or edit the dashboard.
- Save and share: Once you’re happy with your dashboard layout, click ‘Save’ to finalize it. You can also share the dashboard with your team by clicking ‘Share’ and selecting who should have access (specific individuals or teams).
Tips for optimizing your HubSpot dashboards
Once your dashboard is set up, you’ll want to fine-tune it so it’s easy to use and shows the most important data. This will help your team work better and make informed decisions quickly.
Here are some tips for improving your HubSpot dashboards:
- Keep it focused: Limit your dashboard to 5-7 key metrics that give you the most valuable insights.
- Use color coding: Distinguish between different metrics with color coding; e.g., red for deals behind schedule and green for successful closures.
- Automate updates: Make sure your dashboards auto-refresh to keep your data as up-to-date as possible.
- Revisit regularly: Sales processes evolve, so review and update your dashboard every quarter to reflect current priorities.
Common dashboard mistakes
When setting up and using HubSpot dashboards, there are some common mistakes that can make them less helpful. By avoiding these, you’ll keep your dashboard useful and easy for your sales team to work with:
- Overloading the dashboard: Including too many reports or metrics can overwhelm users and dilute the dashboard's focus. Stick to the most critical metrics to avoid clutter.
- Unclear KPIs: If the key performance indicators (KPIs) you’re tracking are too vague or don’t align with your sales goals, your dashboard won’t provide actionable insights. Ensure that each metric is directly tied to a measurable outcome.
- Not customizing for the audience: A one-size-fits-all dashboard might not be ideal for every team member. Consider creating customized dashboards for different roles (e.g., sales managers vs. sales reps) to display the most relevant data for each user.
- Neglecting regular updates: Failing to review and update your dashboard regularly can result in outdated information that no longer reflects the sales process. Schedule quarterly audits to ensure the data and metrics are still relevant.
- Ignoring real-time needs: If your team requires live, real-time data but relies on HubSpot’s near-real-time updates, your dashboard might not be fully effective. For real-time needs, consider using a tool like Geckoboard which has a free trial.
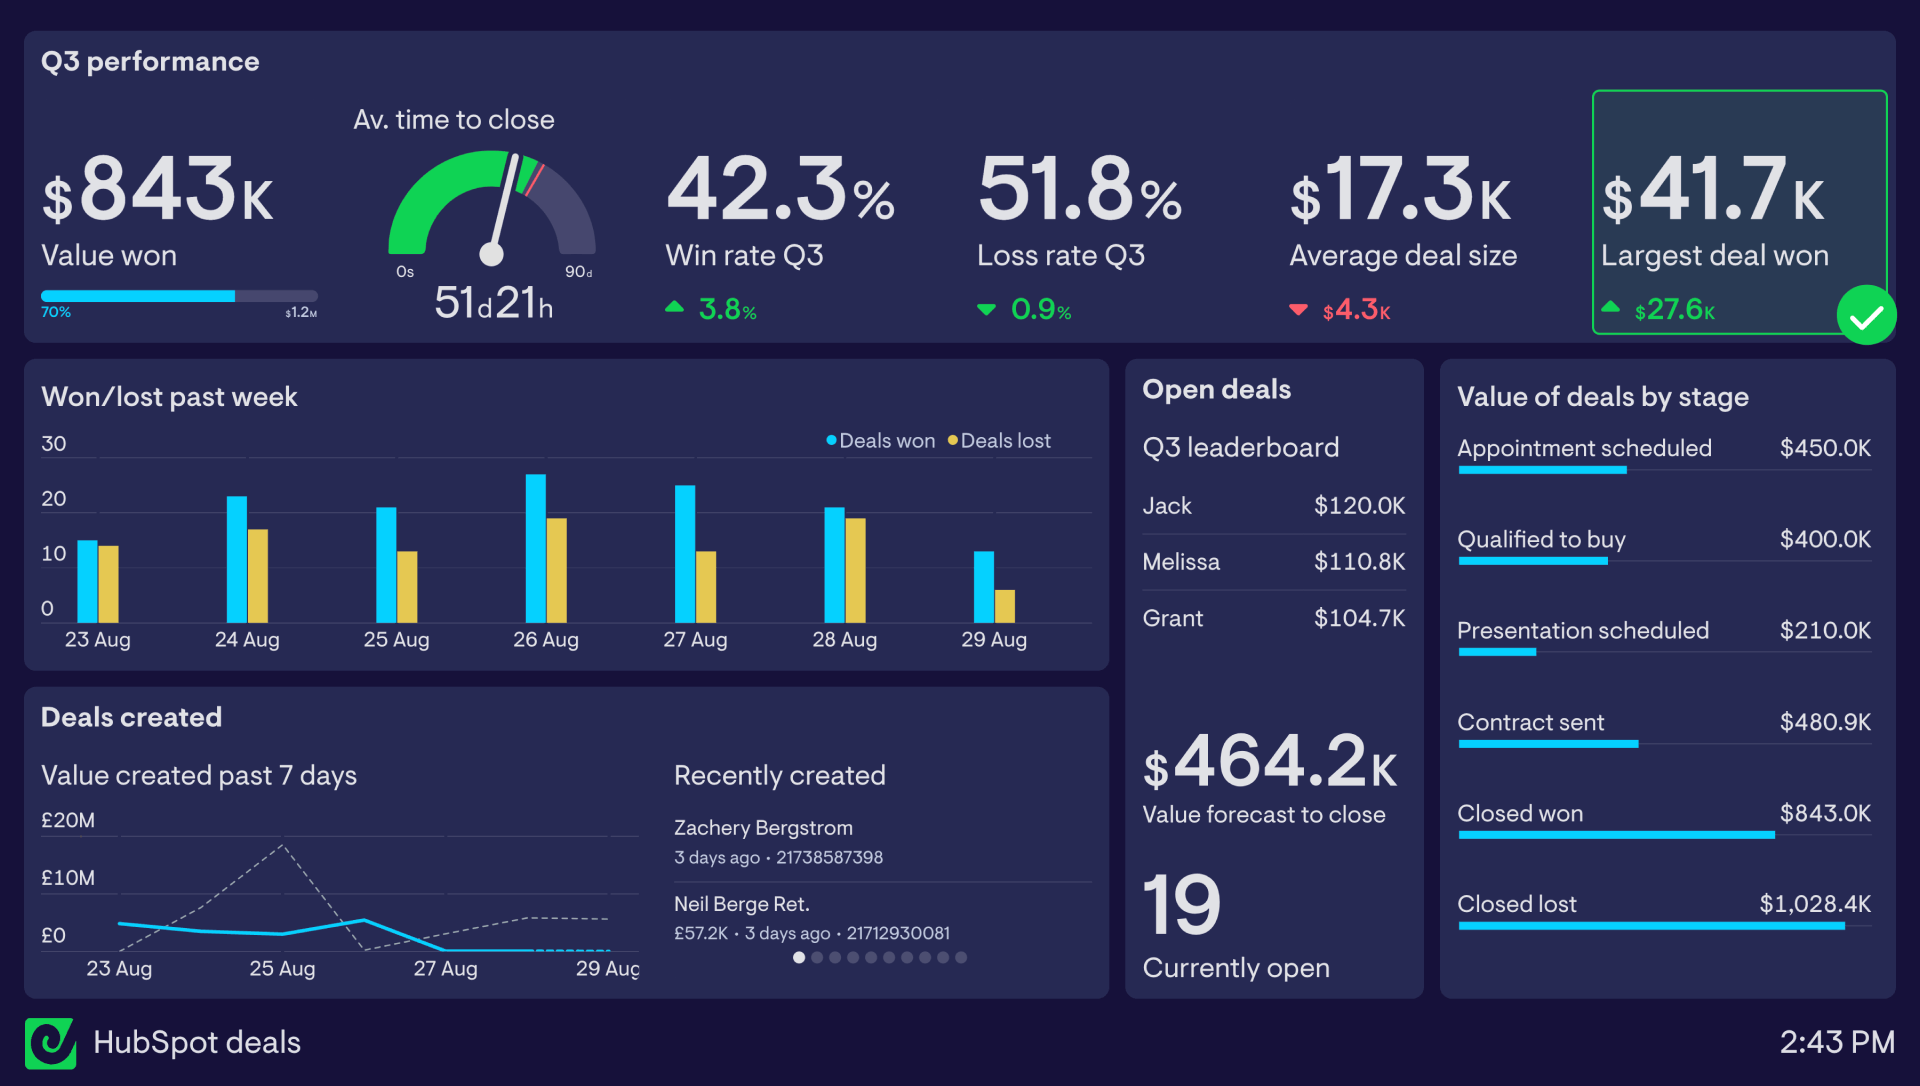
Using your HubSpot sales data
HubSpot dashboards provide a powerful, nearly real-time overview of your sales performance, helping your team stay on track. While they are frequently updated, they may not be fast enough for teams requiring true real-time insights or data from multiple sources.
In such cases, Geckoboard can offer real-time updates and multi-platform integrations, providing a more comprehensive solution. By following these tips and leveraging the right tools, you can create dashboards that drive performance and keep your team aligned with your sales goals.
