Managing a sales pipeline can feel overwhelming without the right insights. Deals are progressing, but without clear data, it’s tough to know what’s working and what’s holding things up. That’s where HubSpot’s sales pipeline reporting comes in. It gives you visibility into every stage of your pipeline, helping you catch issues early and keep your team focused on the most important tasks.
In this guide, we’ll explain how to get the most out of reporting on your HubSpot sales pipeline. You’ll learn how and why to share these reports with the right people, to be sure that they’re being used to drive better decisions. Whether it’s identifying bottlenecks, forecasting revenue, or tracking team performance, these reports will help you take control of your sales process and keep everything running smoothly.
Setting up a sales pipeline dashboard
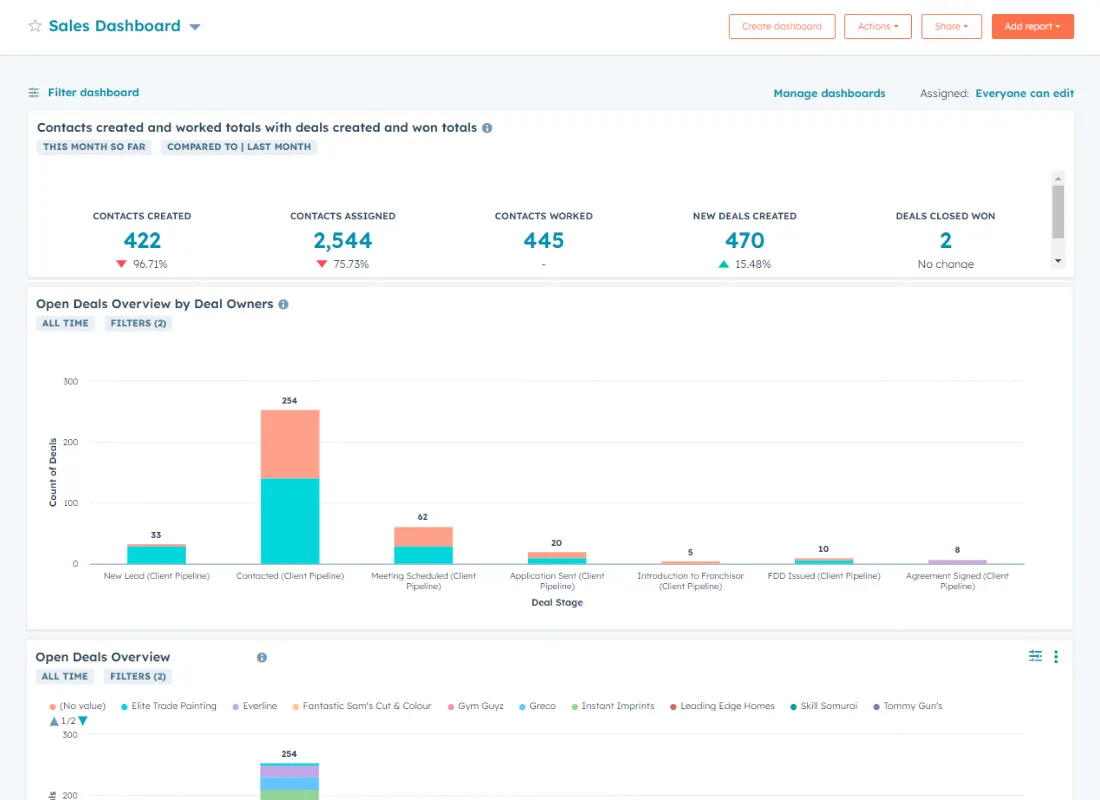
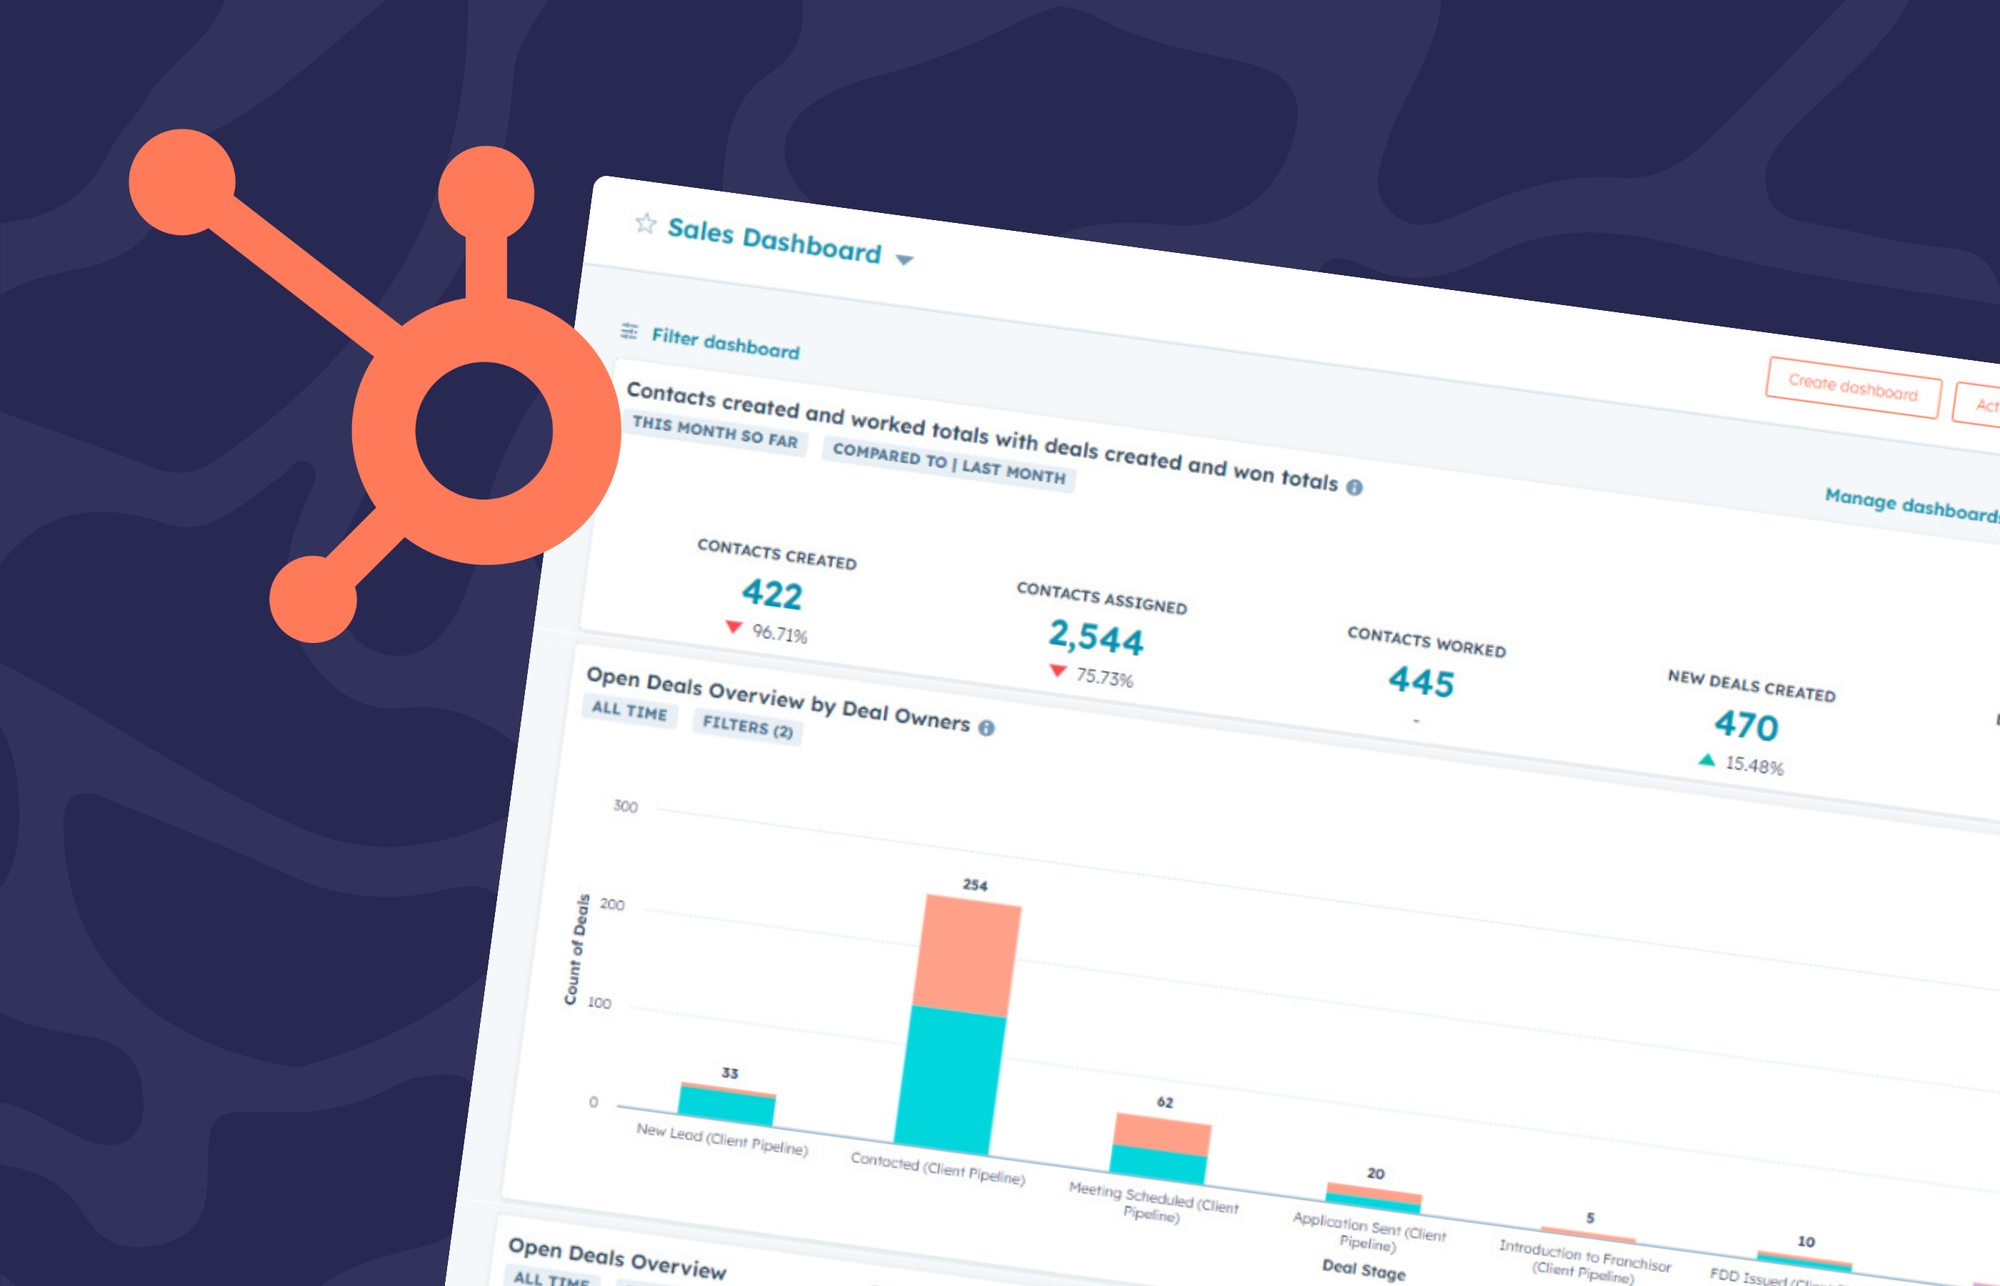
Before diving into reporting, the first step is setting up a custom sales pipeline dashboard in HubSpot. Think of this dashboard as your central hub for all things sales-related. It gives you real-time insights into how deals are progressing and helps you track key metrics like deal velocity and win rates.
If you’re unsure how to get started, check out our post on setting up HubSpot dashboards for a step-by-step guide. It’s a great resource to help you build a dashboard that fits your needs.
Why sales pipeline reports matter
Once you have a dashboard set up, it’s time to talk about why sales pipeline reports are so important. These reports are essentially the compass for your sales team. They show where deals are progressing, where they’re stalling, and whether you're on track to meet your goals.
Reports give you the visibility to identify bottlenecks, forecast revenue, and adjust your sales strategies. They’re not just a luxury; they’re a necessity for any well-functioning sales operation.
Types of sales pipeline reports you should be creating
When it comes to sales pipeline reports, there are a few types that will provide you with the most value. By focusing on these key report types, you’ll get a comprehensive view of your sales pipeline, tracking progress, predicting revenue, identifying successes and failures, and monitoring your team’s efforts. Let’s break them down:
- Deal stage reports: These reports track where each deal is within your sales pipeline. By seeing how deals move through each stage, you can quickly spot where things might be stalling. For example, if a lot of deals are getting stuck in the ‘Negotiation’ stage, it might be time to revisit your pricing strategy or improve negotiation skills.
- Sales forecasting reports: These reports help predict future revenue based on the deals currently in your pipeline. By analyzing the likelihood of deals closing and the value of each, sales forecasting gives you a clearer idea of what revenue to expect in the coming weeks or months. This is crucial for executives and managers who need to plan resources, set expectations, and make strategic decisions. A good forecasting report shows not just what’s in the pipeline but when it’s likely to close.
- Win/loss reports: Win/loss reports analyze which deals your team is winning and losing, and why. Understanding the reasons behind wins and losses can help to refine your sales strategies. For instance, if many deals are being lost to a specific competitor, it could signal the need for stronger competitive positioning. These reports are great for identifying areas for improvement in both your sales process and product offering.
- Activity reports: These reports track the actions taken by your sales team, like calls made, emails sent, and meetings scheduled. Activity reports help correlate sales efforts with deal progress. These reports are especially useful for managers to monitor productivity and understand what activities are driving success.
Who needs to see your sales reports?
Your sales pipeline data holds valuable insights for everyone in the organization. Executives, sales managers, and sales reps all have different needs, so it's important to tailor your reports to each group.
Customizing your reports for these different audiences ensures that each person gets the information that’s most relevant to them.
Customizing reports for different audiences
- Executives care about top-level metrics such as revenue projections, deal velocity, and pipeline value. They need a quick snapshot of overall performance to make informed, high-level decisions.
- Sales managers need more granular reports. They want to see how individual reps are performing, which deals are moving (or stalling) through the pipeline, and what actions are driving success. This helps them manage the team effectively and address any issues.
- Sales reps benefit from highly specific, personal reports. They need to know which deals need immediate attention, how their activity levels compare to targets, and where they can focus to maximize their performance. Customizing reports to show individual progress and deal priorities gives them clear direction.
When you tailor reports to suit the needs of each group, you empower them to take meaningful action based on relevant, actionable insights.
How to make sure reports are actually seen
Creating valuable reports is only half the battle; ensuring they get in front of the right eyes is just as important. Here’s how to make sure your sales pipeline reports aren’t ignored:
- Automate email reports in HubSpot to send them directly to key stakeholders. Set up scheduled deliveries-daily, weekly, or monthly-so everyone gets the sharable data they need without having to manually pull reports. This ensures that your team always has up-to-date information in their inbox.
- For teams that need quick, real-time updates, HubSpot’s daily summary emails can include pipeline snapshots. These snapshots give a concise overview of deals, deal stages, and expected revenue, keeping everyone informed on a day-to-day basis.
- To give your reports maximum visibility, consider displaying live sales pipeline data on an office TV screen. Geckoboard can pull real-time data from HubSpot and display it in a visually engaging way, keeping critical metrics front and center for your entire team. When the data is right in front of everyone, they’re more likely to act on it.
How to know when your reporting isn’t working
Even with a solid HubSpot sales reporting system, things can go off track. If your team isn’t acting on the insights from your reports, it’s a sign something’s wrong. Here are some common issues to watch out for:
- Data overload: If the reports are too detailed or complicated, team members may not engage with them. Simplifying the reports can make them more useful.
- Out-of-date information: If your reports aren’t being updated regularly, decisions may be based on outdated data. Make sure your reports are refreshed to prevent this issue.
- Low engagement: If no one is checking the reports, it might be time to rethink how you deliver them. Try adjusting the format, making them more accessible, or displaying them in a high-visibility area like an office TV screen.
Recognizing these signs early will help you optimize your reporting process and make sure your team is getting the most value from the data.
Turn your reports into actionable insights
Sales pipeline reports are a powerful tool when used effectively. They give you the visibility you need to understand how your sales process is performing, where improvements can be made, and how to keep your team on track. By tailoring reports to meet the needs of each audience and sharing them in ways that ensure they’re seen and used, you can transform raw data into clear, actionable insights.
With the right approach to reporting, you’ll not only track progress but also drive meaningful action, helping your business stay focused, adaptable, and ready for growth.
