In the early stages of a business, reporting is usually straightforward. You have a small set of KPIs, and not many people who need to see them.
In fact, when I launched my first business – an online magazine – I had exactly one KPI (Number of Subscribers), and the only people who needed to see this metric was me and my co-founder. Needless to say – our ‘reporting system’ was a simple task that could be completed in less than two minutes every Monday morning – using Google Analytics and a spreadsheet.
However, as companies grow, business reporting becomes more complex. There are different types of report, at different levels of granularity. And these reports need to be consumed by more and more people.
It’s at this point, business leaders are presented with a common choice:
- Continue with manual reporting
- Use a BI tool to automate your reporting
But guess what? There is a third option, which many businesses don’t know about – read on to find out more.
Should I upgrade to a BI tool?
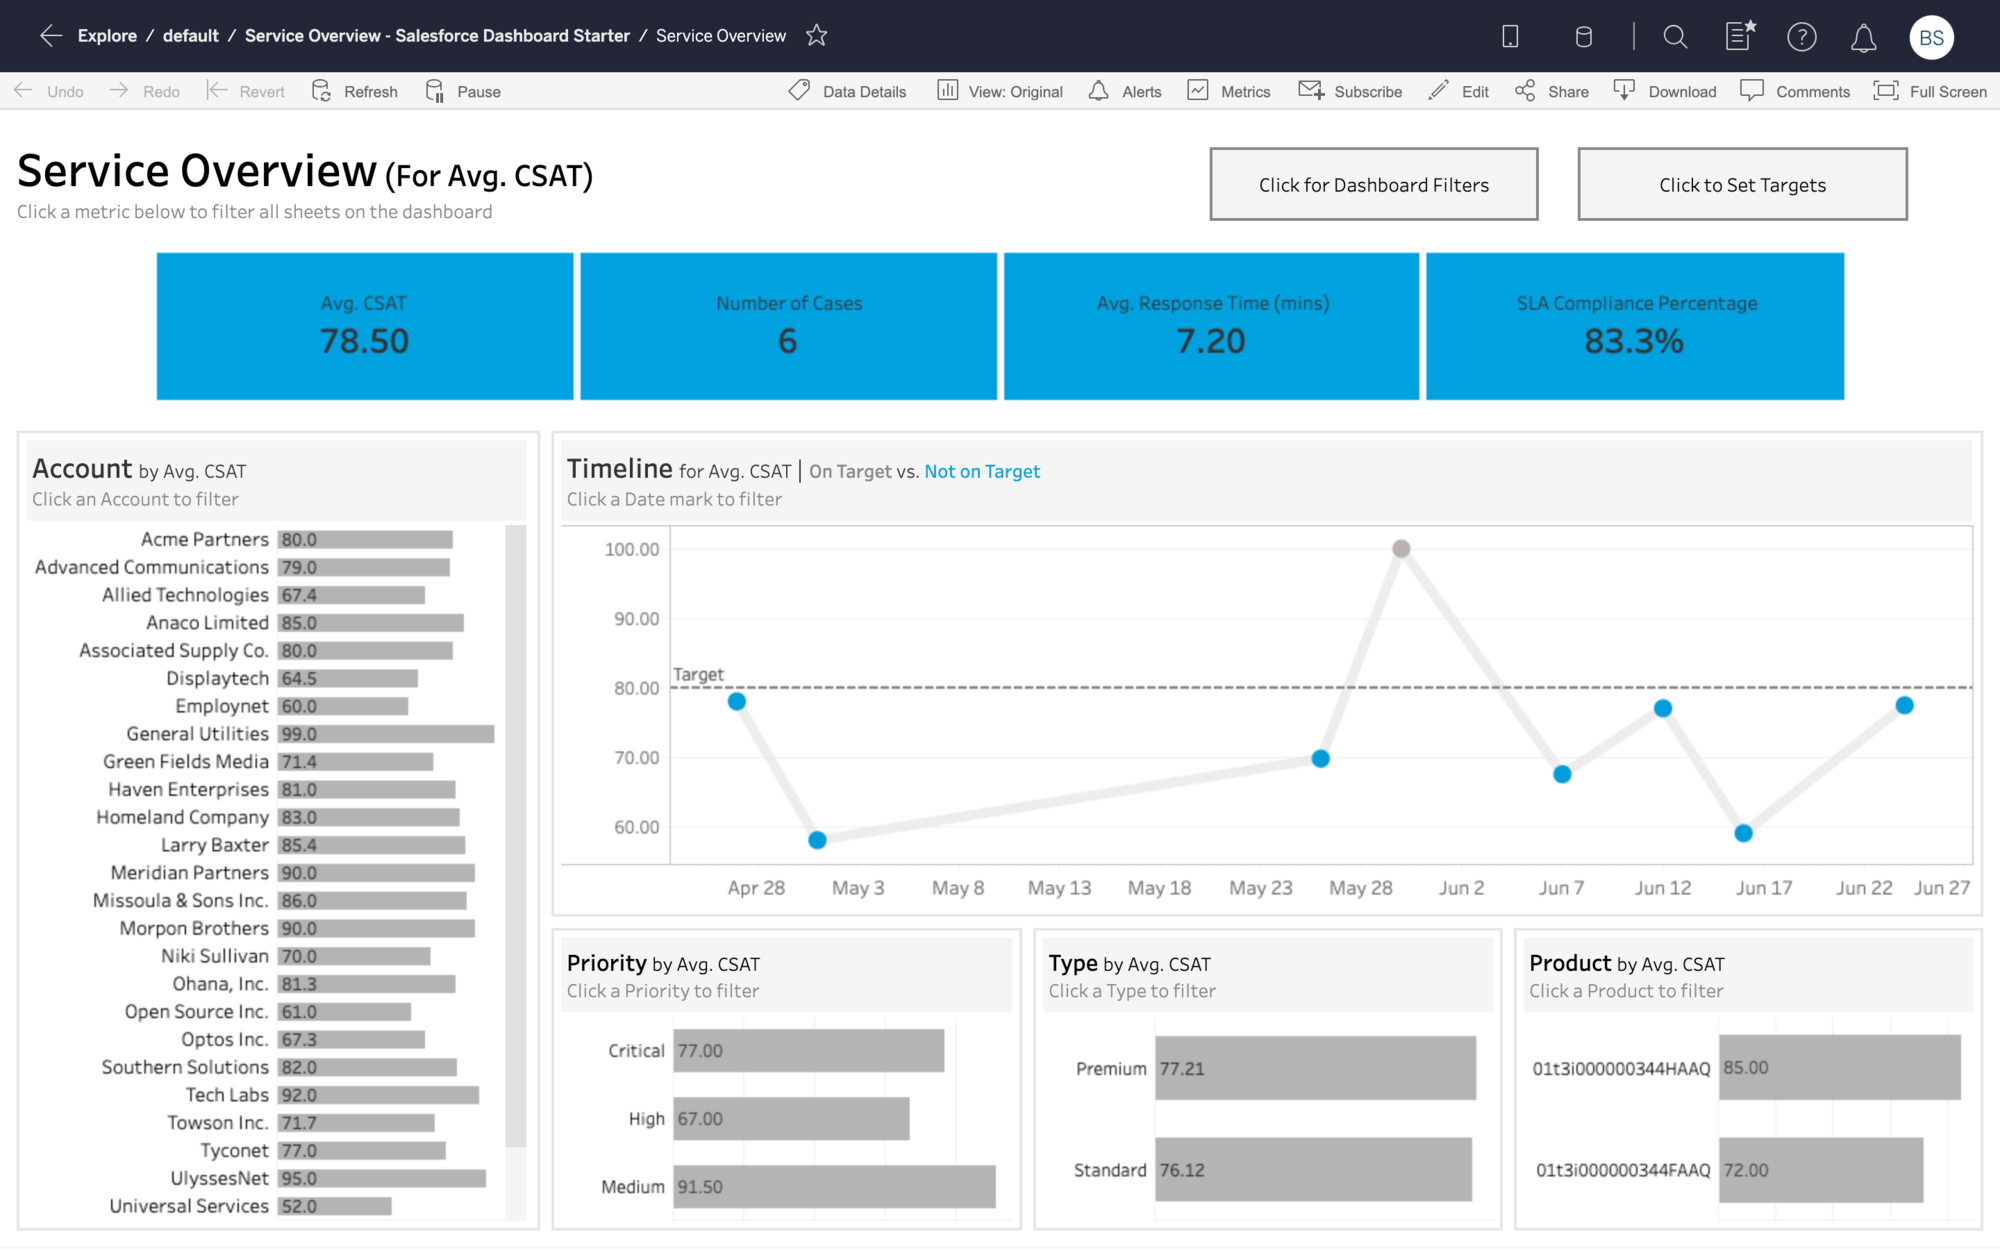
A Business Intelligence (BI) tool allows you to set up reports and dashboards that visualize your business data. You may have previously heard of popular BI tools like Tableau and Power BI.
Most large businesses use some form of BI tool to deliver on their reporting. And so this option is usually presented to smaller businesses (SMBs) as the default way of generating reports automatically.
However, investing in BI tools can be a massive leap for SMBs. Not just because BI tools are advanced pieces of software that require investment in time, skills and money. But because a BI tool won’t actually automate your reporting on its own.
That’s because BI tools are designed to work in tandem with something called a data warehouse, which stores all your business data in one place.
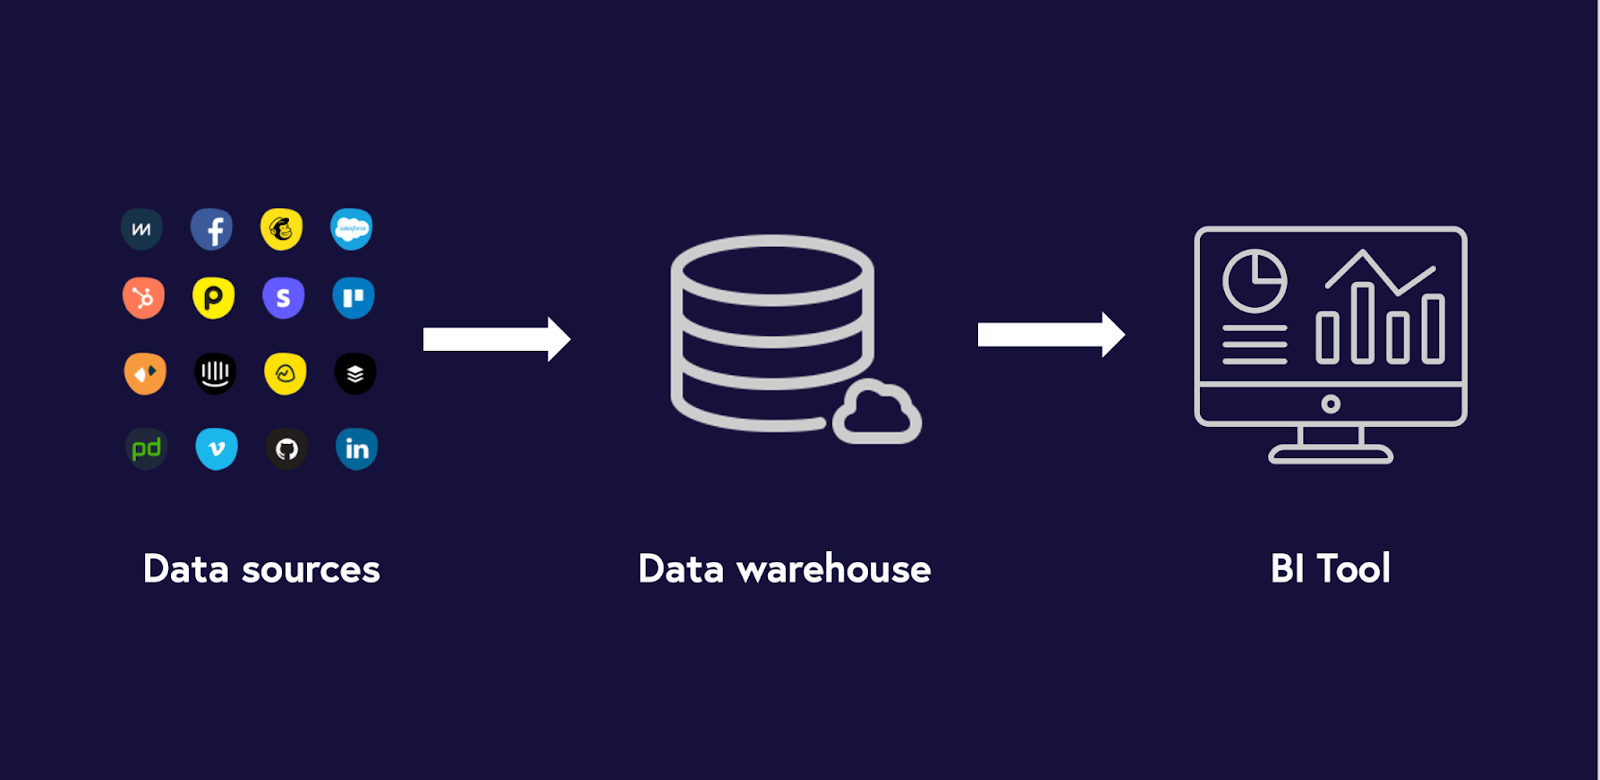
To set up a data warehouse, you will need a data specialist who can write SQL and work with APIs. Even then, it’s not always straightforward connecting your data warehouse to tools like Salesforce, Shopify, Zendesk or Google Analytics.
And by ‘not always straightforward’, I mean it’s never straightforward.
For most SMBs, the time it takes to set up and use a BI tool is simply not matched by the time they would save from automating their reporting. And so they are back where they started – in a manual, spreadsheet-powered wilderness.
Is manual reporting really so bad?
The obvious downside with manual reporting is that it’s time-consuming.
A typical SMB generates KPIs in multiple platforms. You have a sales platform, a support platform, a finance platform, plus various marketing and web analytics tools.
It takes time to download CSVs. It takes time to structure the data in a way you can work with. And it takes even more time to present that data in a way your colleagues or stakeholders can make quick sense of.
You can delegate this task to a junior member of the team, but then you’re left with the anxiety of human error. (So you spend the same amount of time checking their work!)
It’s not uncommon for founders to tell us that they or senior members of the team spend days each month pulling together reports for board meetings, and other internal meetings.
Fortunately, much like Gollum in the marshes, we know another way.

Using Geckoboard for quick reporting
Geckoboard is a KPI dashboard tool that’s popular with businesses who want to broadcast real-time metrics to their team.
However, in recent years, it’s launched some useful new features which make it a great lightweight reporting tool.
Unlike a BI tool, Geckoboard connects directly to business tools like Salesforce, Shopify and Zendesk in just a few clicks.
That means you won’t be able to perform analysis on your data like you would with a BI tool. However, if you just need to report metrics from different data sources, then it's perfect for saving time.
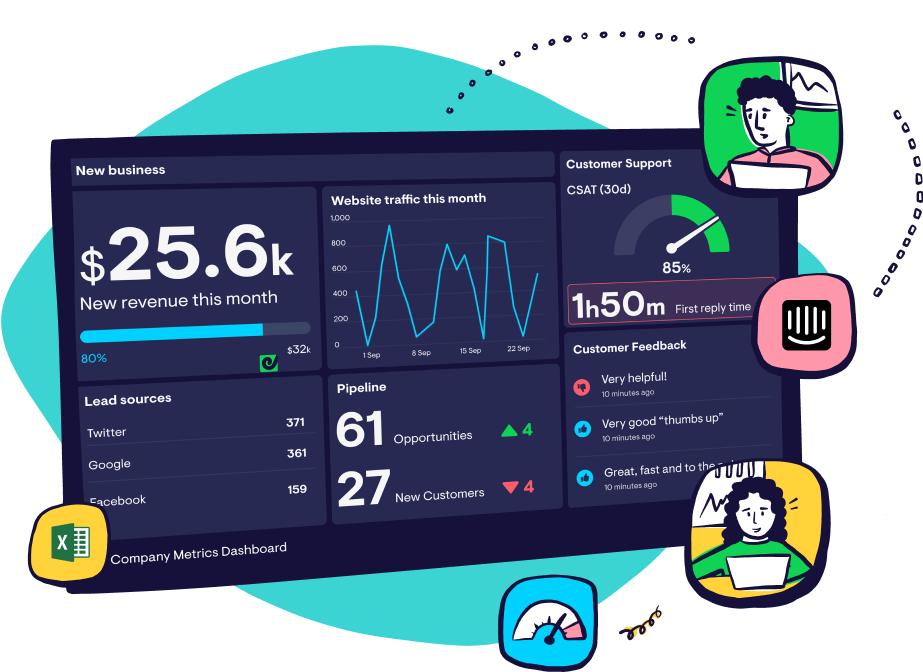
Just take a look at this dashboard which is automatically generating data from Shopify and Facebook Ads.
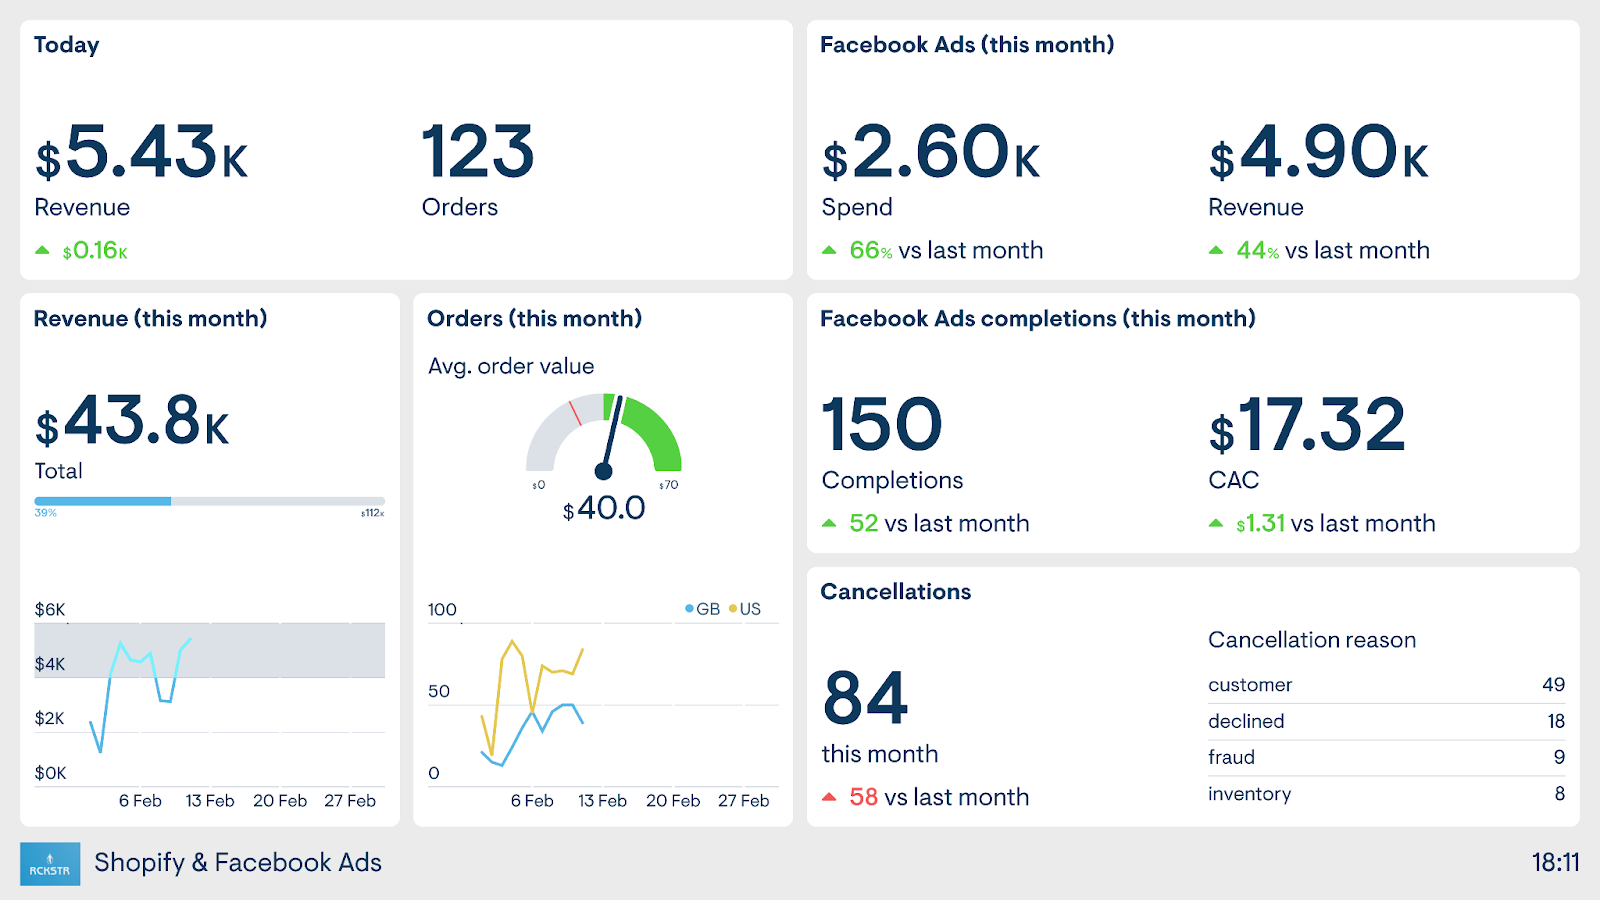
Instead of spending time downloading data from Shopify and Facebook, you can quickly design a dashboard in Geckoboard that contains everything a data driven team might need.
How to turn a Geckoboard dashboard into a report?
To turn a dashboard into a report, you just need to set the individual widgets to display historical time filters. For example: yesterday, last week or last month.
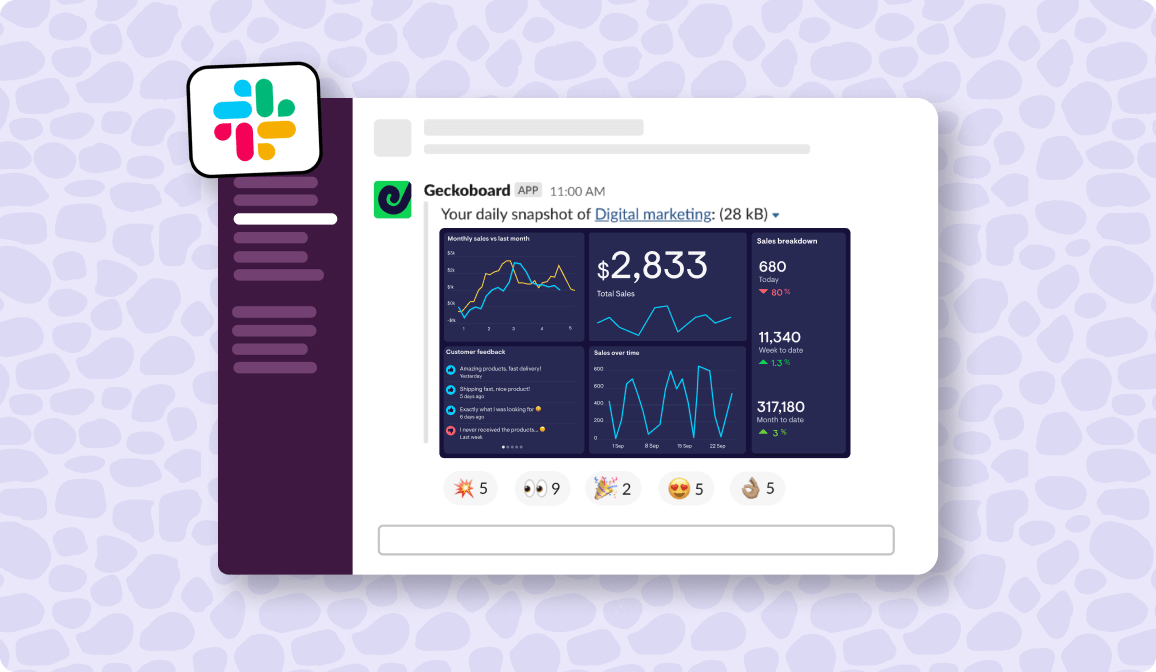
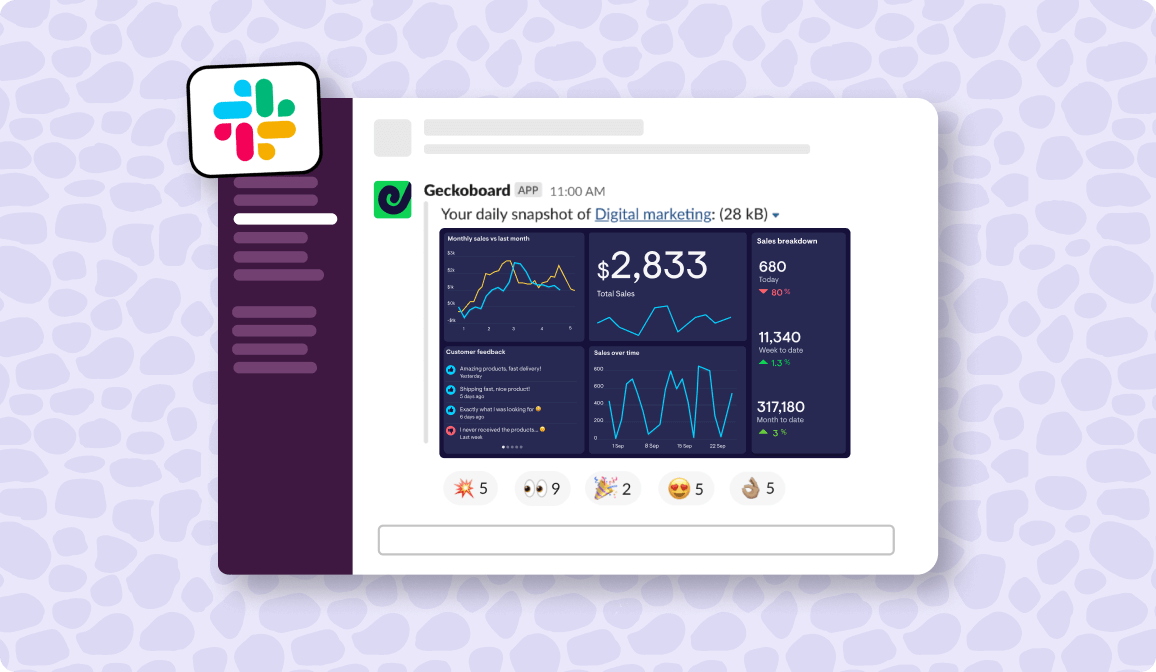
You can then schedule reports and snapshots to be sent directly to you or your team via email or Slack – on a day and time that suits you.
What Geckoboard customers say
Data Analyst, Michael Brooke would spend an hour each day creating reports for his Support Manager:
“We work with large energy suppliers so we have a lot of regulations to meet when it comes to Customer Support. I was spending an hour every day pulling reports from various different places in Zendesk into an Excel spreadsheet to share with our clients. When I realized Geckoboard could automatically pull all of that data into a dashboard and send a scheduled snapshot at the end of each day, I was so happy!”
Try Geckoboard for free
Want to set up your own reports? Geckoboard connects to over 90 data sources, and you can build your first dashboard in just 15 minutes. Try Geckoboard for free for 14 days.