As a sales manager, you need clear, actionable data that helps you make informed decisions. Key performance indicators (KPIs) are essential metrics that keep you on track, and building a dashboard in HubSpot can help you monitor these KPIs efficiently.
Let’s get started with a simple dashboard.
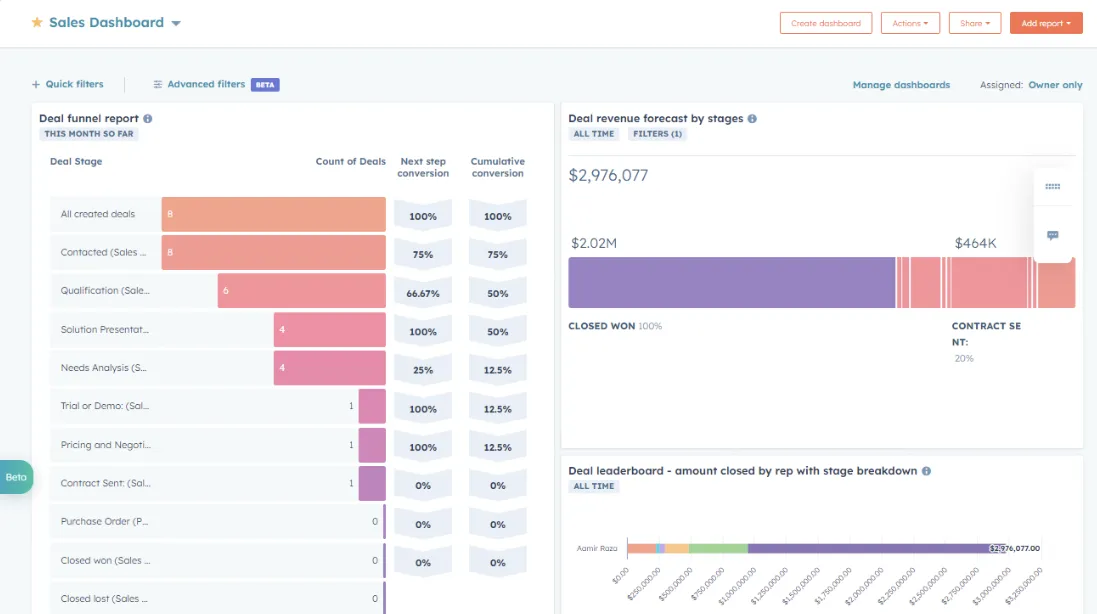
How to build a simple HubSpot dashboard in 5 steps
- Go to ‘Reports’ and select ‘Dashboards’.
- Click ‘Create Dashboard’ and name it.
- Add ‘Reports’ by selecting your key metrics (like revenue or conversions).
- Organize the layout by dragging and dropping reports.
- ‘Save’ and ‘Share’ with your team.
That’s enough to get started, but designing a dashboard that evolves with your sales strategy, empowers your team, and provides a 360-degree view of your performance does require some more work.
The rest of this guide delves into some additional steps to help you to create a flexible, dynamic dashboard that scales with your business and adapts to your changing goals.
Step 1: Align KPIs with your evolving sales strategy
Choosing your KPIs isn’t a one-time decision. As your business grows, your KPIs should evolve to reflect shifting priorities and objectives. You may start by tracking basic metrics like revenue and deal volume, but as your team expands, you’ll need more nuanced KPIs that measure efficiency, team performance, and customer lifetime value.
- Early-stage businesses may focus on core metrics like total revenue, average deal size, and lead conversion rates.
- Growing businesses often track metrics like sales cycle length, pipeline velocity, and customer acquisition cost (CAC).
- Scaling businesses need more complex metrics like customer lifetime value (CLV), churn rate, and the percentage of repeat business.
This step is about future-proofing your dashboard. Think beyond your immediate needs and ask, "What metrics will matter six months from now?" By thinking ahead, you’ll save yourself from constantly rebuilding your dashboard as your sales strategy matures.
Step 2: Build a multi-layered dashboard
While many sales dashboards focus on current performance, a well-rounded KPI dashboard offers both real-time insights and historical trends. To get the full picture, your dashboard should balance both high-level overviews and detailed breakdowns that help you identify trends.
A multi-layered dashboard allows you to move fluidly between a general overview and specific data points, creating a dashboard that is adaptable to multiple team members with different roles.
- Top-level overview: This includes must-have metrics like current revenue, open deals, and conversion rates. These metrics give you an indication on overall performance.
- Mid-level metrics: Track deal stage distribution, lead source performance, and sales cycle length. These reports highlight how deals are progressing and where potential slowdowns are happening.
- Drill-down reports: Add drill-down metrics like sales performance by rep, product line success, and geographic trends. These insights help you spot issues and find opportunities for improvement.
Step 3: Automate and update your dashboard in real-time
Static reports can quickly become outdated, and manual data entry has a high risk of error. HubSpot’s automation tools ensure that your KPI dashboard stays relevant by pulling in the latest data without requiring manual updates.
- Set up daily, weekly, and monthly data pulls: Depending on the nature of the KPI, configure automated updates to fit the reporting cycle. Revenue and pipeline reports might refresh daily, while customer lifetime value might be calculated monthly.
- Monitor real-time data through integrations: If you need live updates on specific metrics, partners like Geckoboard can pull in data from multiple systems in real time, offering a more immediate snapshot of performance across your tools.
Step 4: Adapt your dashboard as your team scales
As your sales team grows, your KPI dashboard needs to keep pace. The metrics that work for a five-person sales team might not be enough for a team of 50. At this point, you’ll need to spend some time optimizing your dashboard so it still works for your organization.
- Segment KPIs by team: Create separate views for different sales teams or regions. For example, if you manage multiple territories, create separate revenue reports for each one and track performance regionally.
- Introduce new KPIs gradually: As your business grows, incorporate KPIs like customer retention rates, cross-sell effectiveness, or upsell performance. Avoid adding too many metrics at once to prevent data overload.
- Refine KPI definitions: As sales processes evolve, the definition of success might change. Continuously refine what you’re measuring to match your current goals. For instance, instead of just tracking lead volume, measure lead quality by focusing on leads that reach specific deal stages.
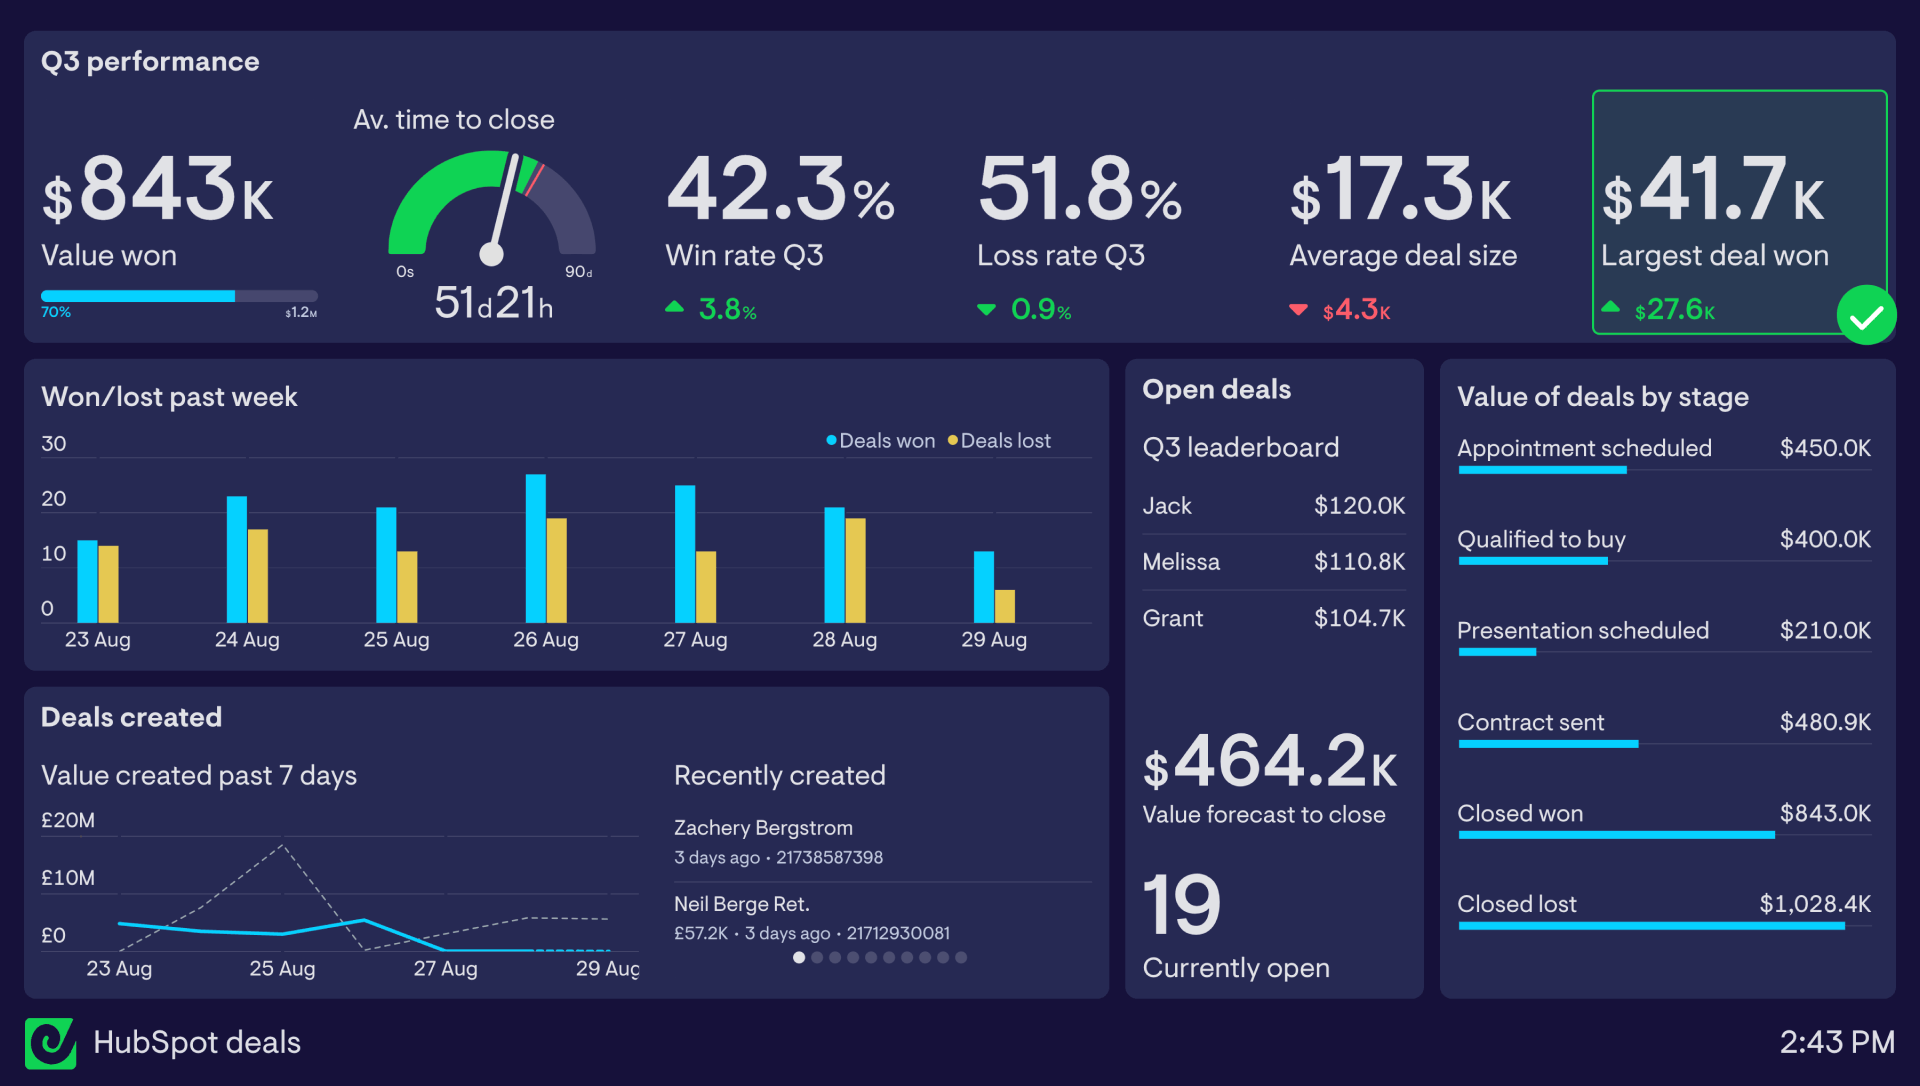
Step 5: Use data visualization to drive team action
The visualization of data can make all the difference in. When KPIs are well-visualized, they not only tell a story but also inspire action. Good visualization can help you and your team spot problems, seize opportunities, and stay on track to meet goals.
- Use heatmaps for deal progress: Use heatmaps to visually highlight deals that are moving through your pipeline quickly versus those that are stuck.
- Use trend graphs for lead generation: Line or bar charts showing lead generation trends over time can reveal patterns, such as seasonal slowdowns or upticks after specific marketing efforts.
- Use goal progress meters: Use goal-tracking visualizations like progress meters to show how close you are to monthly or quarterly sales targets.
Step 6: Build a full picture with multiple data sources
Your KPI dashboard shouldn’t exist in isolation. Often, businesses rely on multiple tools to manage sales, customer support, and operations. Using Geckoboard, you can pull in data from multiple sources like HubSpot, Zendesk, and Zapier, into a single dashboard. This gives you a real-time, 360-degree view of your business operations.
- Geckoboard allows you to display data from various platforms all in one place. You can combine data from HubSpot, Zendesk, Google Sheets, Aircall, and other apps to get a holistic view of your performance.
- Geckoboard pulls in real-time data, so you’re always working with the most up-to-date metrics from all your systems, rather than waiting for periodic updates.
Sign up for a free trial of Geckoboard to bring data from multiple tools into one dashboard.
Step 7: Tailor dashboards for different roles
Different members of your team have different priorities, so a one-size-fits-all dashboard often doesn’t work. Instead, create role-specific dashboards that provide tailored insights for each level of your sales organization.
- For sales reps, focus on individual performance metrics, such as calls made, deals closed, and personal pipeline health.
- For sales managers, highlight team-wide metrics, including total revenue, deal velocity, and lead-to-deal conversion rates.
- For executives, use higher-level KPIs like total revenue growth, sales cycle length, and customer retention to show the overall direction of the business.
- For customer service teams, surface fast-moving data from Service Hub that needs monitoring, like how many tickets are in the queue right now, or current response times.
Providing tailored dashboards keeps the focus on the right metrics for each team member and gives clarity at every level of the sales process.
Creating a HubSpot KPI dashboard that grows with your business
Remember, building a HubSpot KPI dashboard is more than just assembling reports. Whether you’re a small team focused on lead conversion or a growing salesforce tackling complex pipelines, your dashboard should evolve as your business does.
By following these steps and using tools like Geckoboard for multi-source integrations, your KPI dashboard will become an essential asset in driving success and keeping your team on track.
