If your business uses HubSpot for sales, alongside common marketing tools like Google Analytics and LinkedIn, you might eventually find it becomes time-consuming to keep track of all your KPIs.
It’s not just that it’s time-consuming for leaders who need to monitor these performance metrics. The biggest downside is that teams and individuals stay in their silos.
That’s because it’s hard for the sales team to stay on top of what’s happening with marketing tools; and it’s hard for the marketing team to stay on top of what’s happening in HubSpot.
Most teams try to address this with regular manual reporting. But this can be both ineffective and inefficient.
Instead, we’re going to explore how Geckoboard can bring together data from these tools, so you can create custom dashboards that show you exactly the metrics you want to see.
Instead of hassling your team to share reports and updates, you can create a solution that saves you time, and means everyone stays aware of the metrics that matter.
Watch the video of this dashboard being created
What is Geckoboard?
Geckoboard is a KPI dashboard tool that helps you monitor your most important business metrics in real-time. In addition to HubSpot, LinkedIn and Google Analytics, it also connects to over 90 data sources such as Salesforce, Shopify, Zendesk, Google Ads, Facebook, Instagram and Google Sheets.
Unlike more heavyweight BI tools, Geckoboard is different because it’s built for non-technical teams, who want to access data in real-time.
We’re talking about:
- Ease of use: You can connect your data in a few clicks, and build your dashboard in a few minutes. No coding or specialist knowledge required.
- Real-time monitoring: Geckoboard auto-refreshes and supports the fastest possible refresh rates across all our integrations, regardless of your plan.
- Designed to be seen: Sharing options for TV display, desktop, mobile, email and Slack.
Build a dashboard to display HubSpot, LinkedIn and Google Analytics data
Next we’ll show you, step-by-step, how to build a dashboard that visualizes data from HubSpot, LinkedIn and Google Analytics.
Step 1: Sign up to Geckoboard
You can start your fully-featured free trial here – no credit card required.
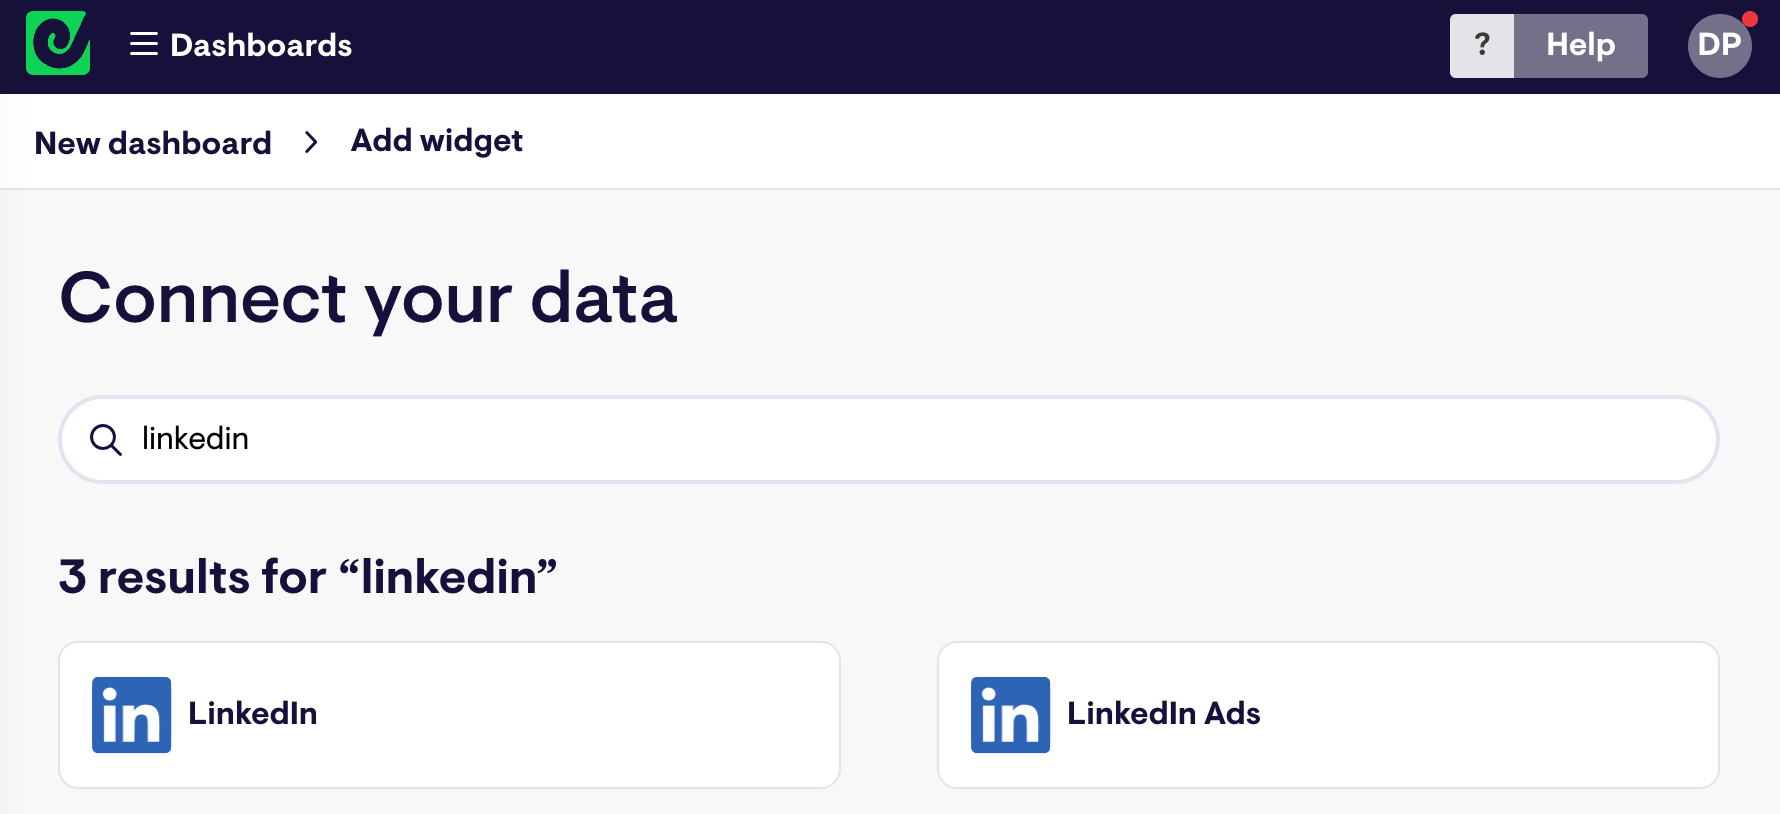
Step 2: Connect LinkedIn
Depending on whether you want to visualize data from your company page (i.e. page followers) or your LinkedIn Advertising campaigns, choose LinkedIn or LinkedIn Ads.
I’ll choose LinkedIn Ads.
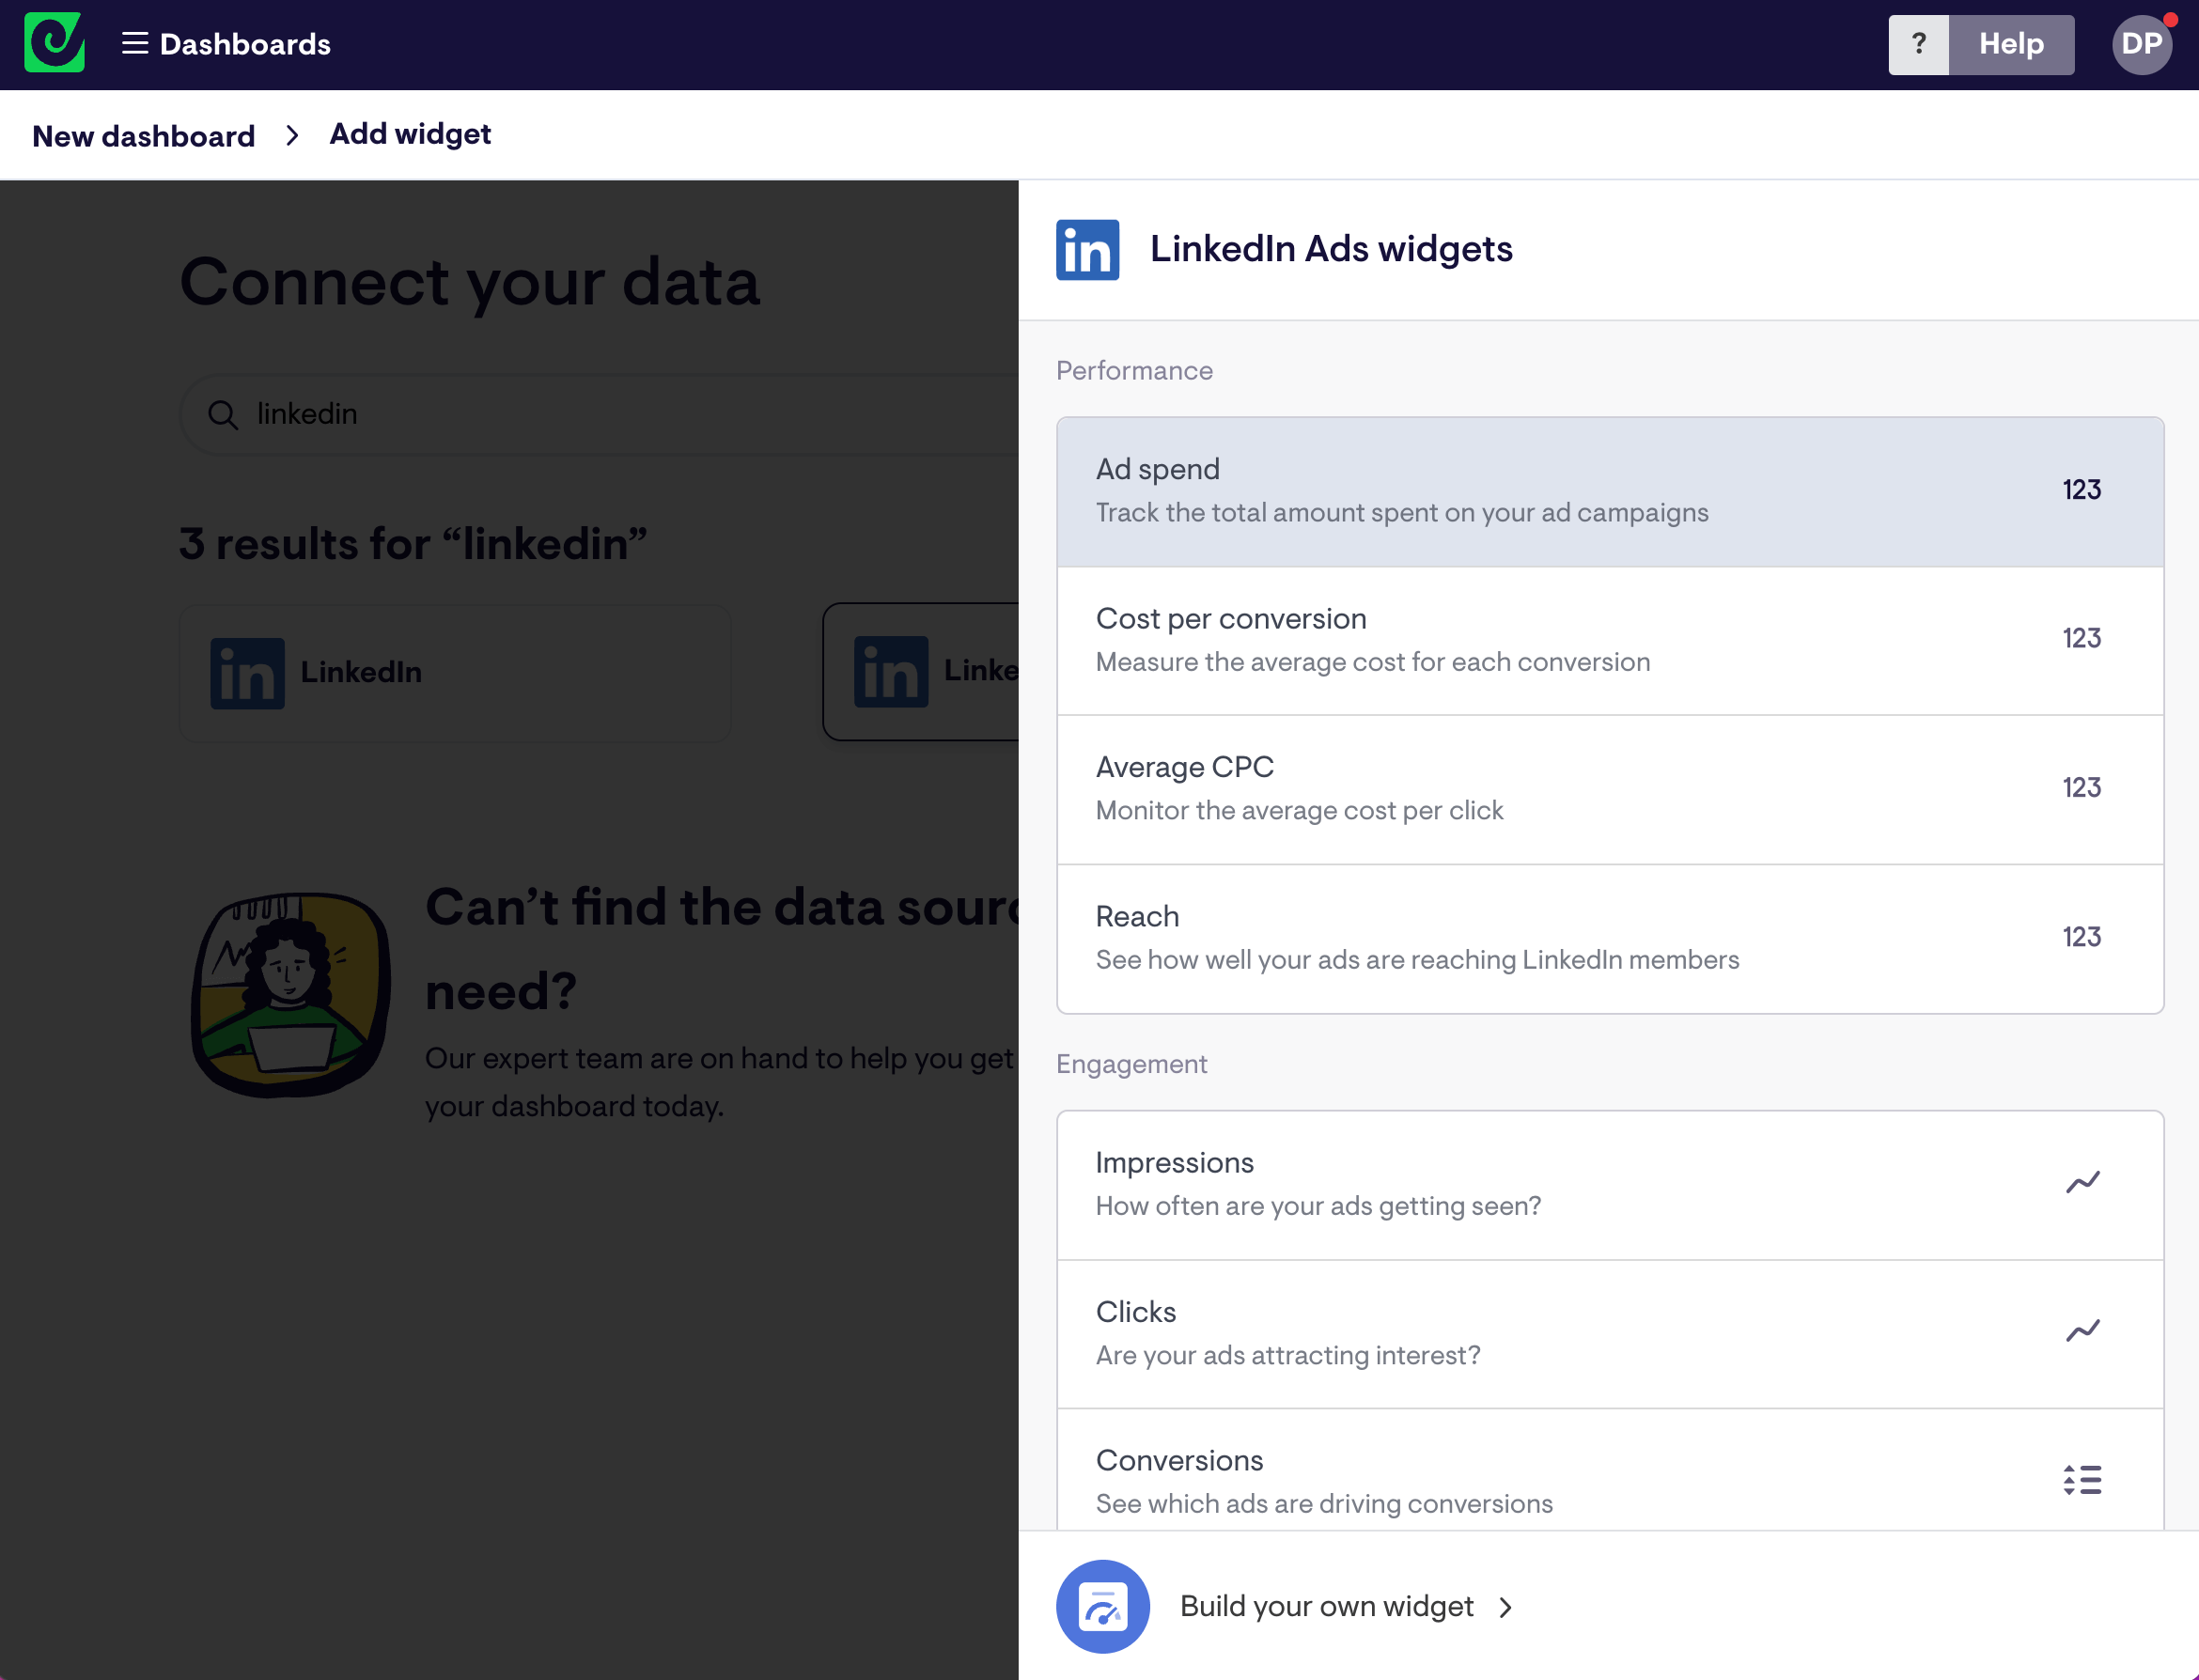
Next I’ll select one of the presets: Ad spend. (But if you want to explore the full range of metrics you can visualize, then select “Build your own widget”)
The next screen will ask you to connect your LinkedIn account.
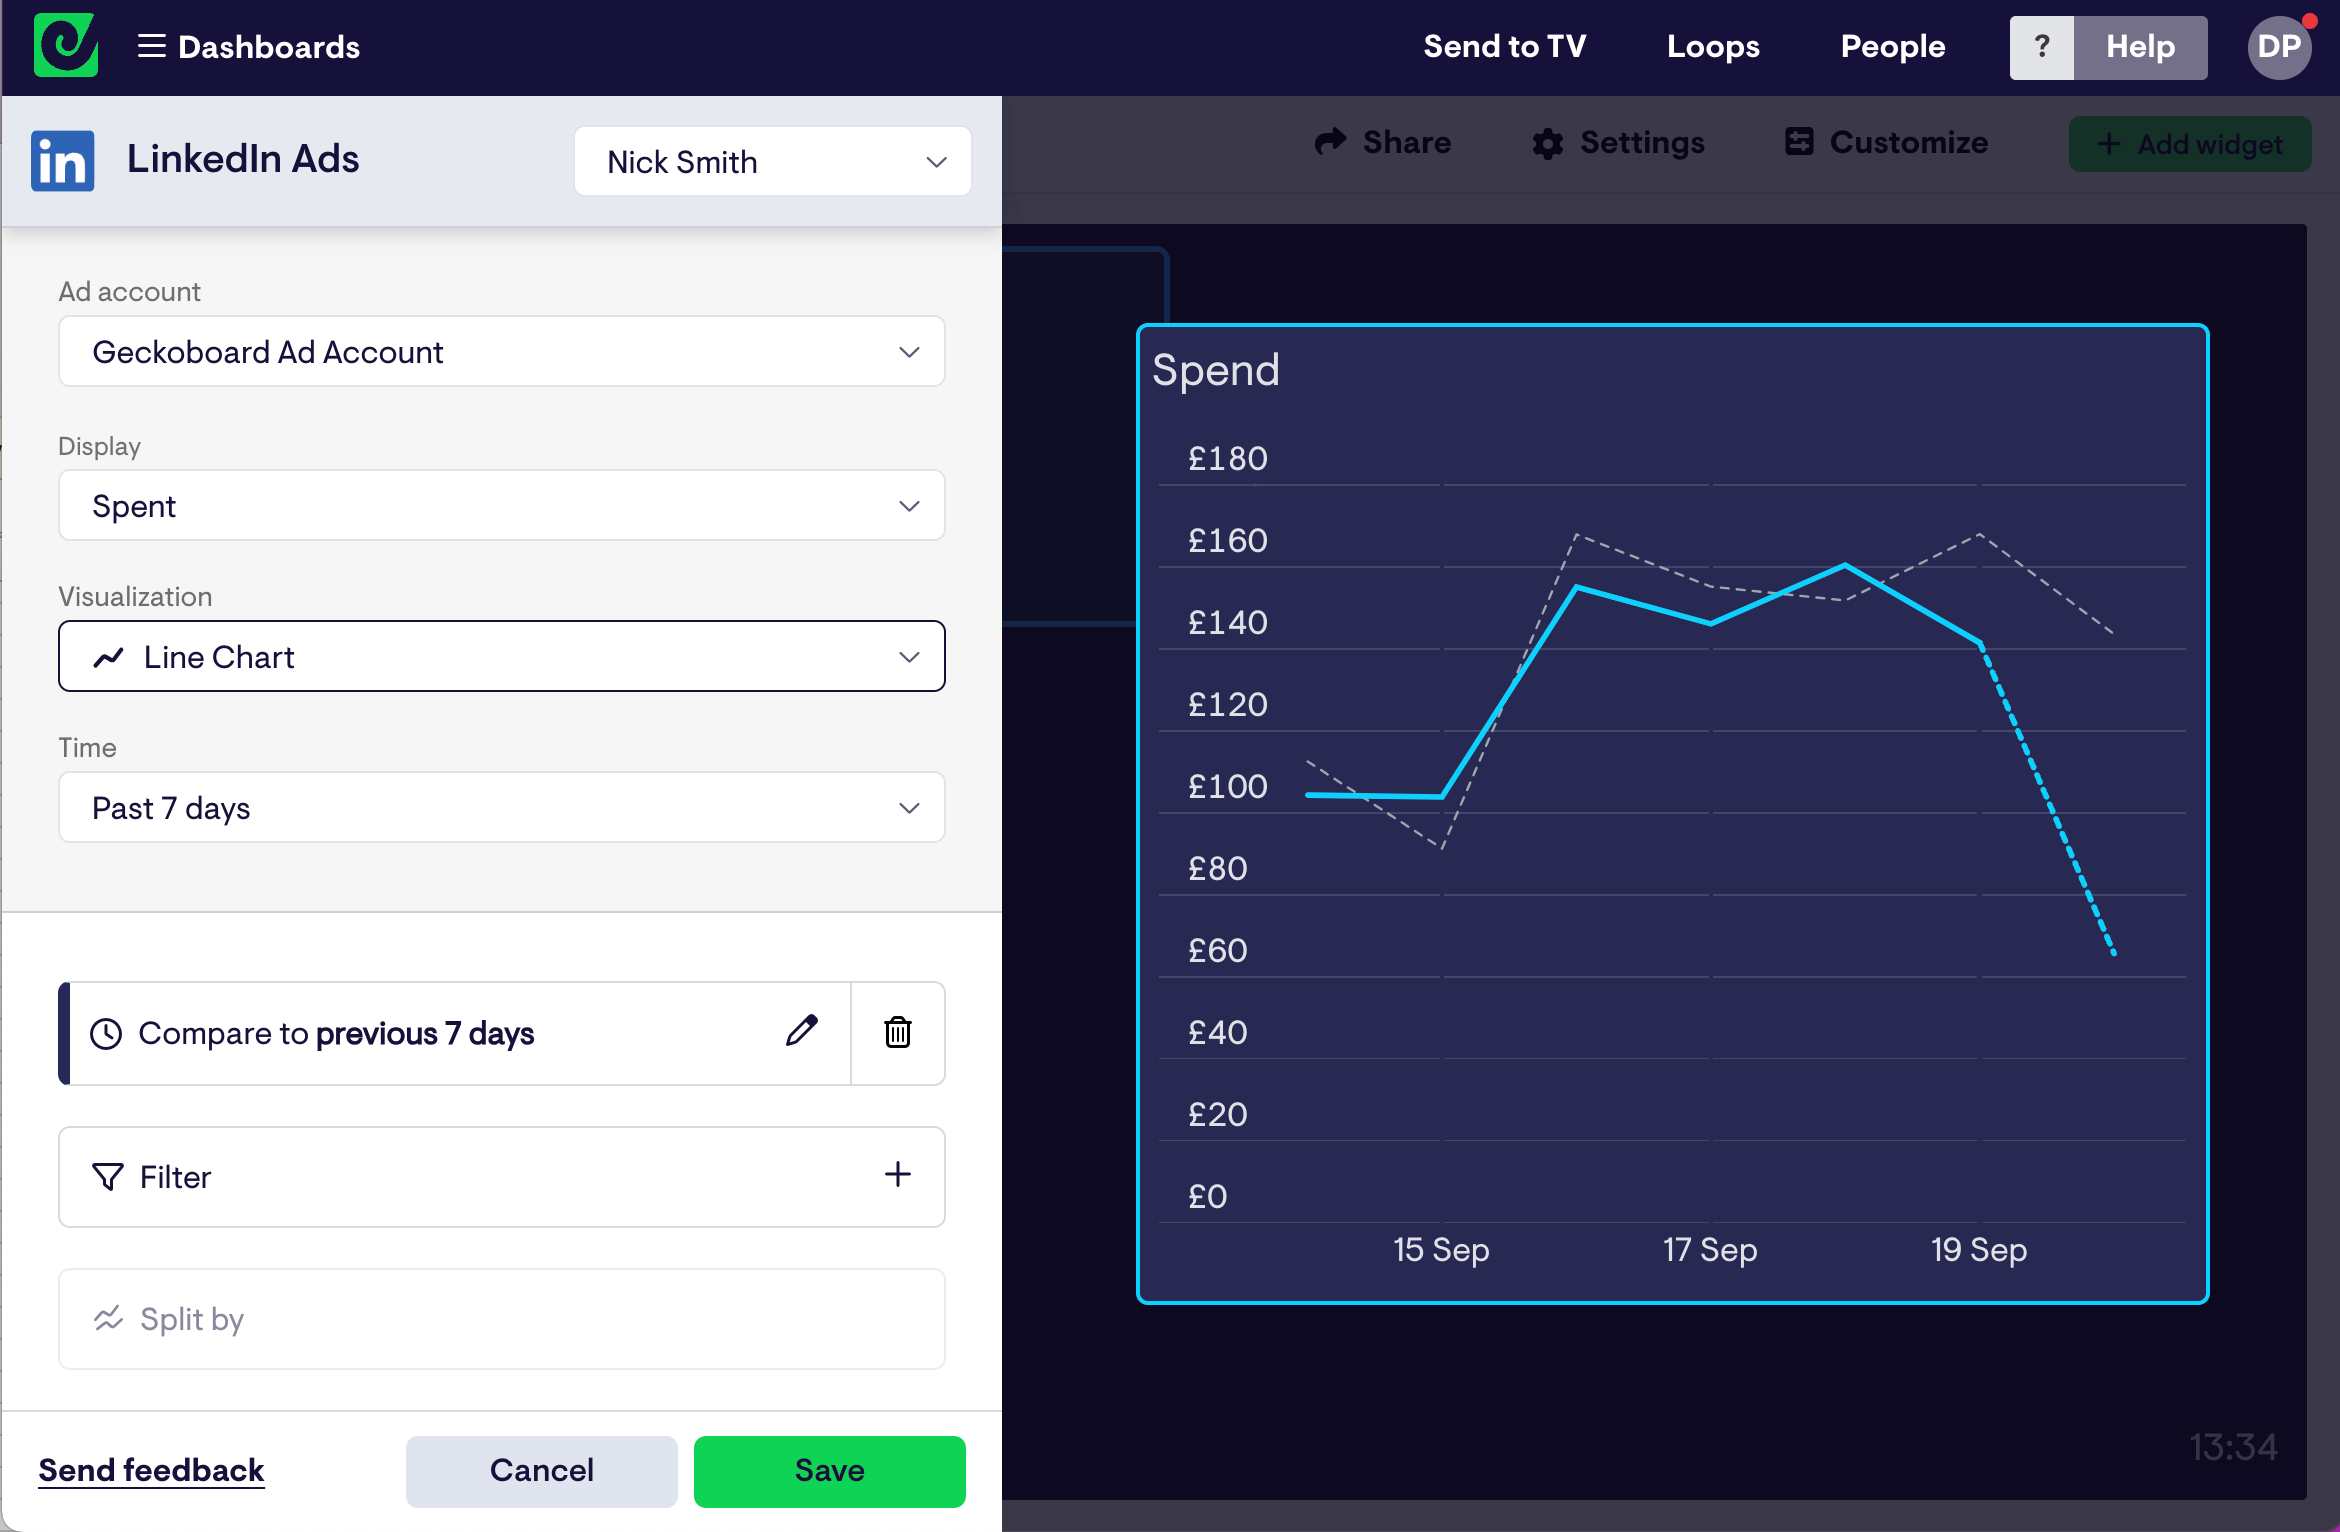
Step 3: Build your first widget
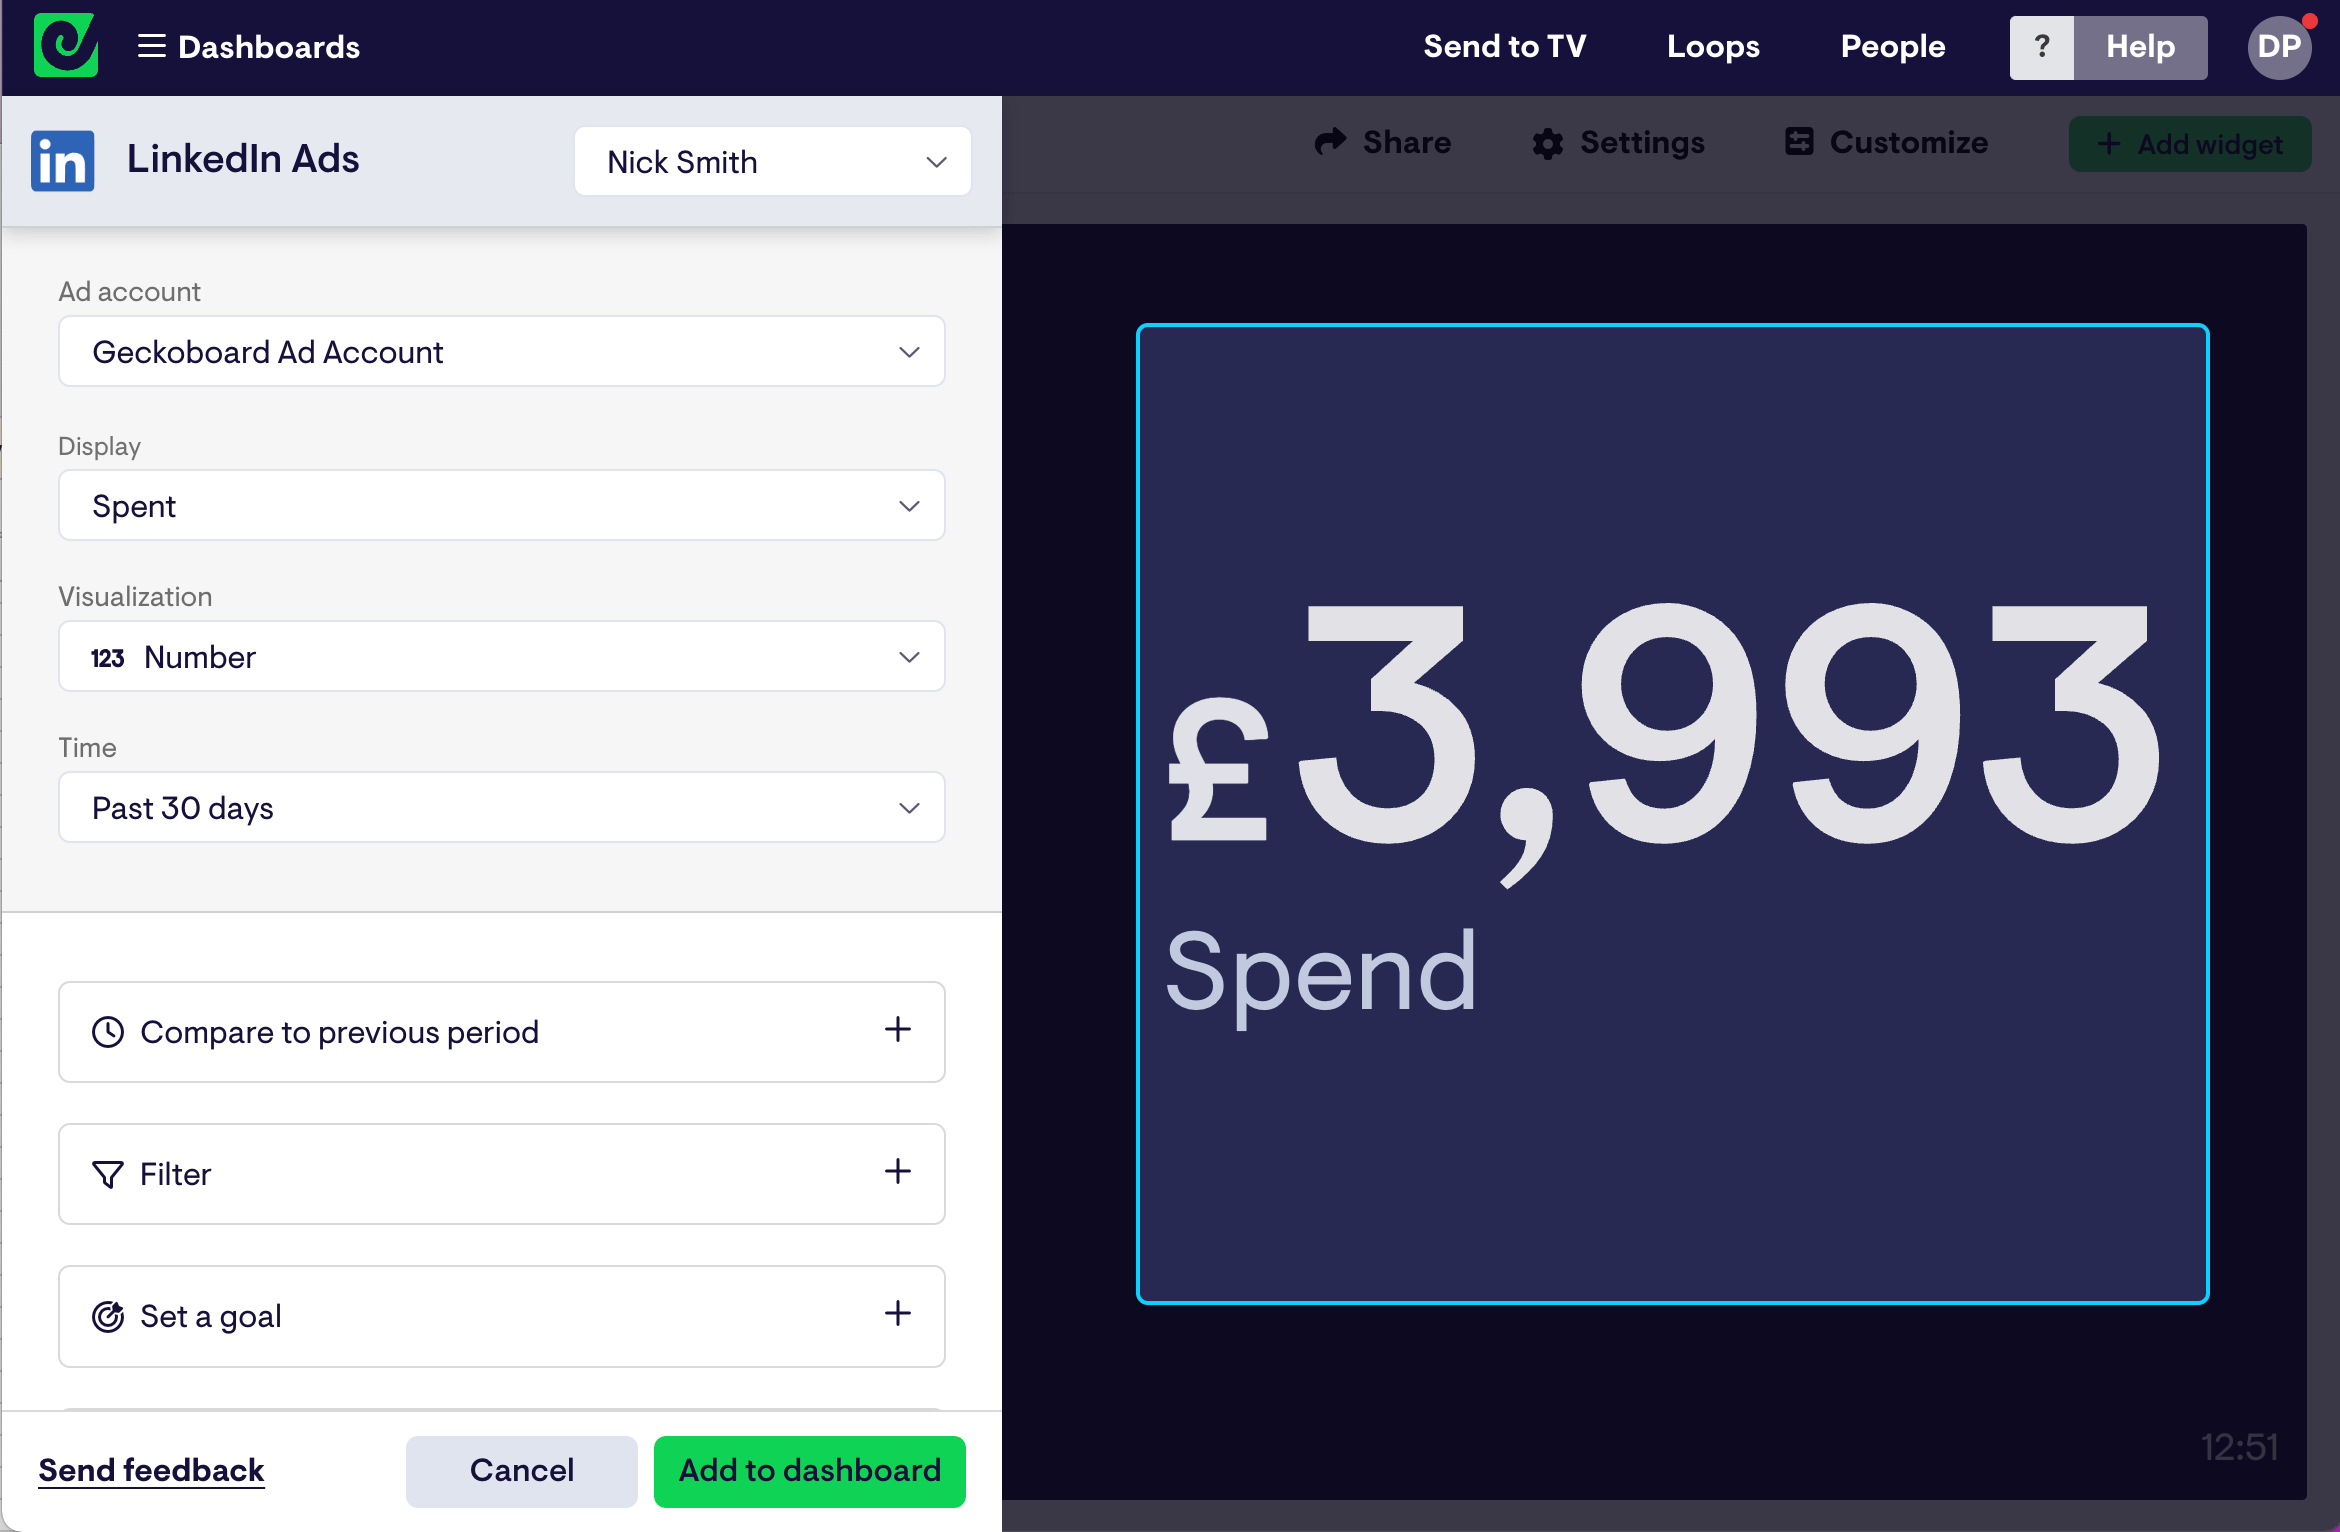
A widget is just a single data visualization we’ll use to populate our dashboard. On the next screen I’m going to fine-tune our widget to get it to show the exact metrics we want to see.
To start off, the widget displays our ad spend for the past 30 days as a simple number widget.
However, on my dashboard, I want to see metrics related to the past 7 days. So I’m going to change the time filter, and also include a comparison to the previous seven days.
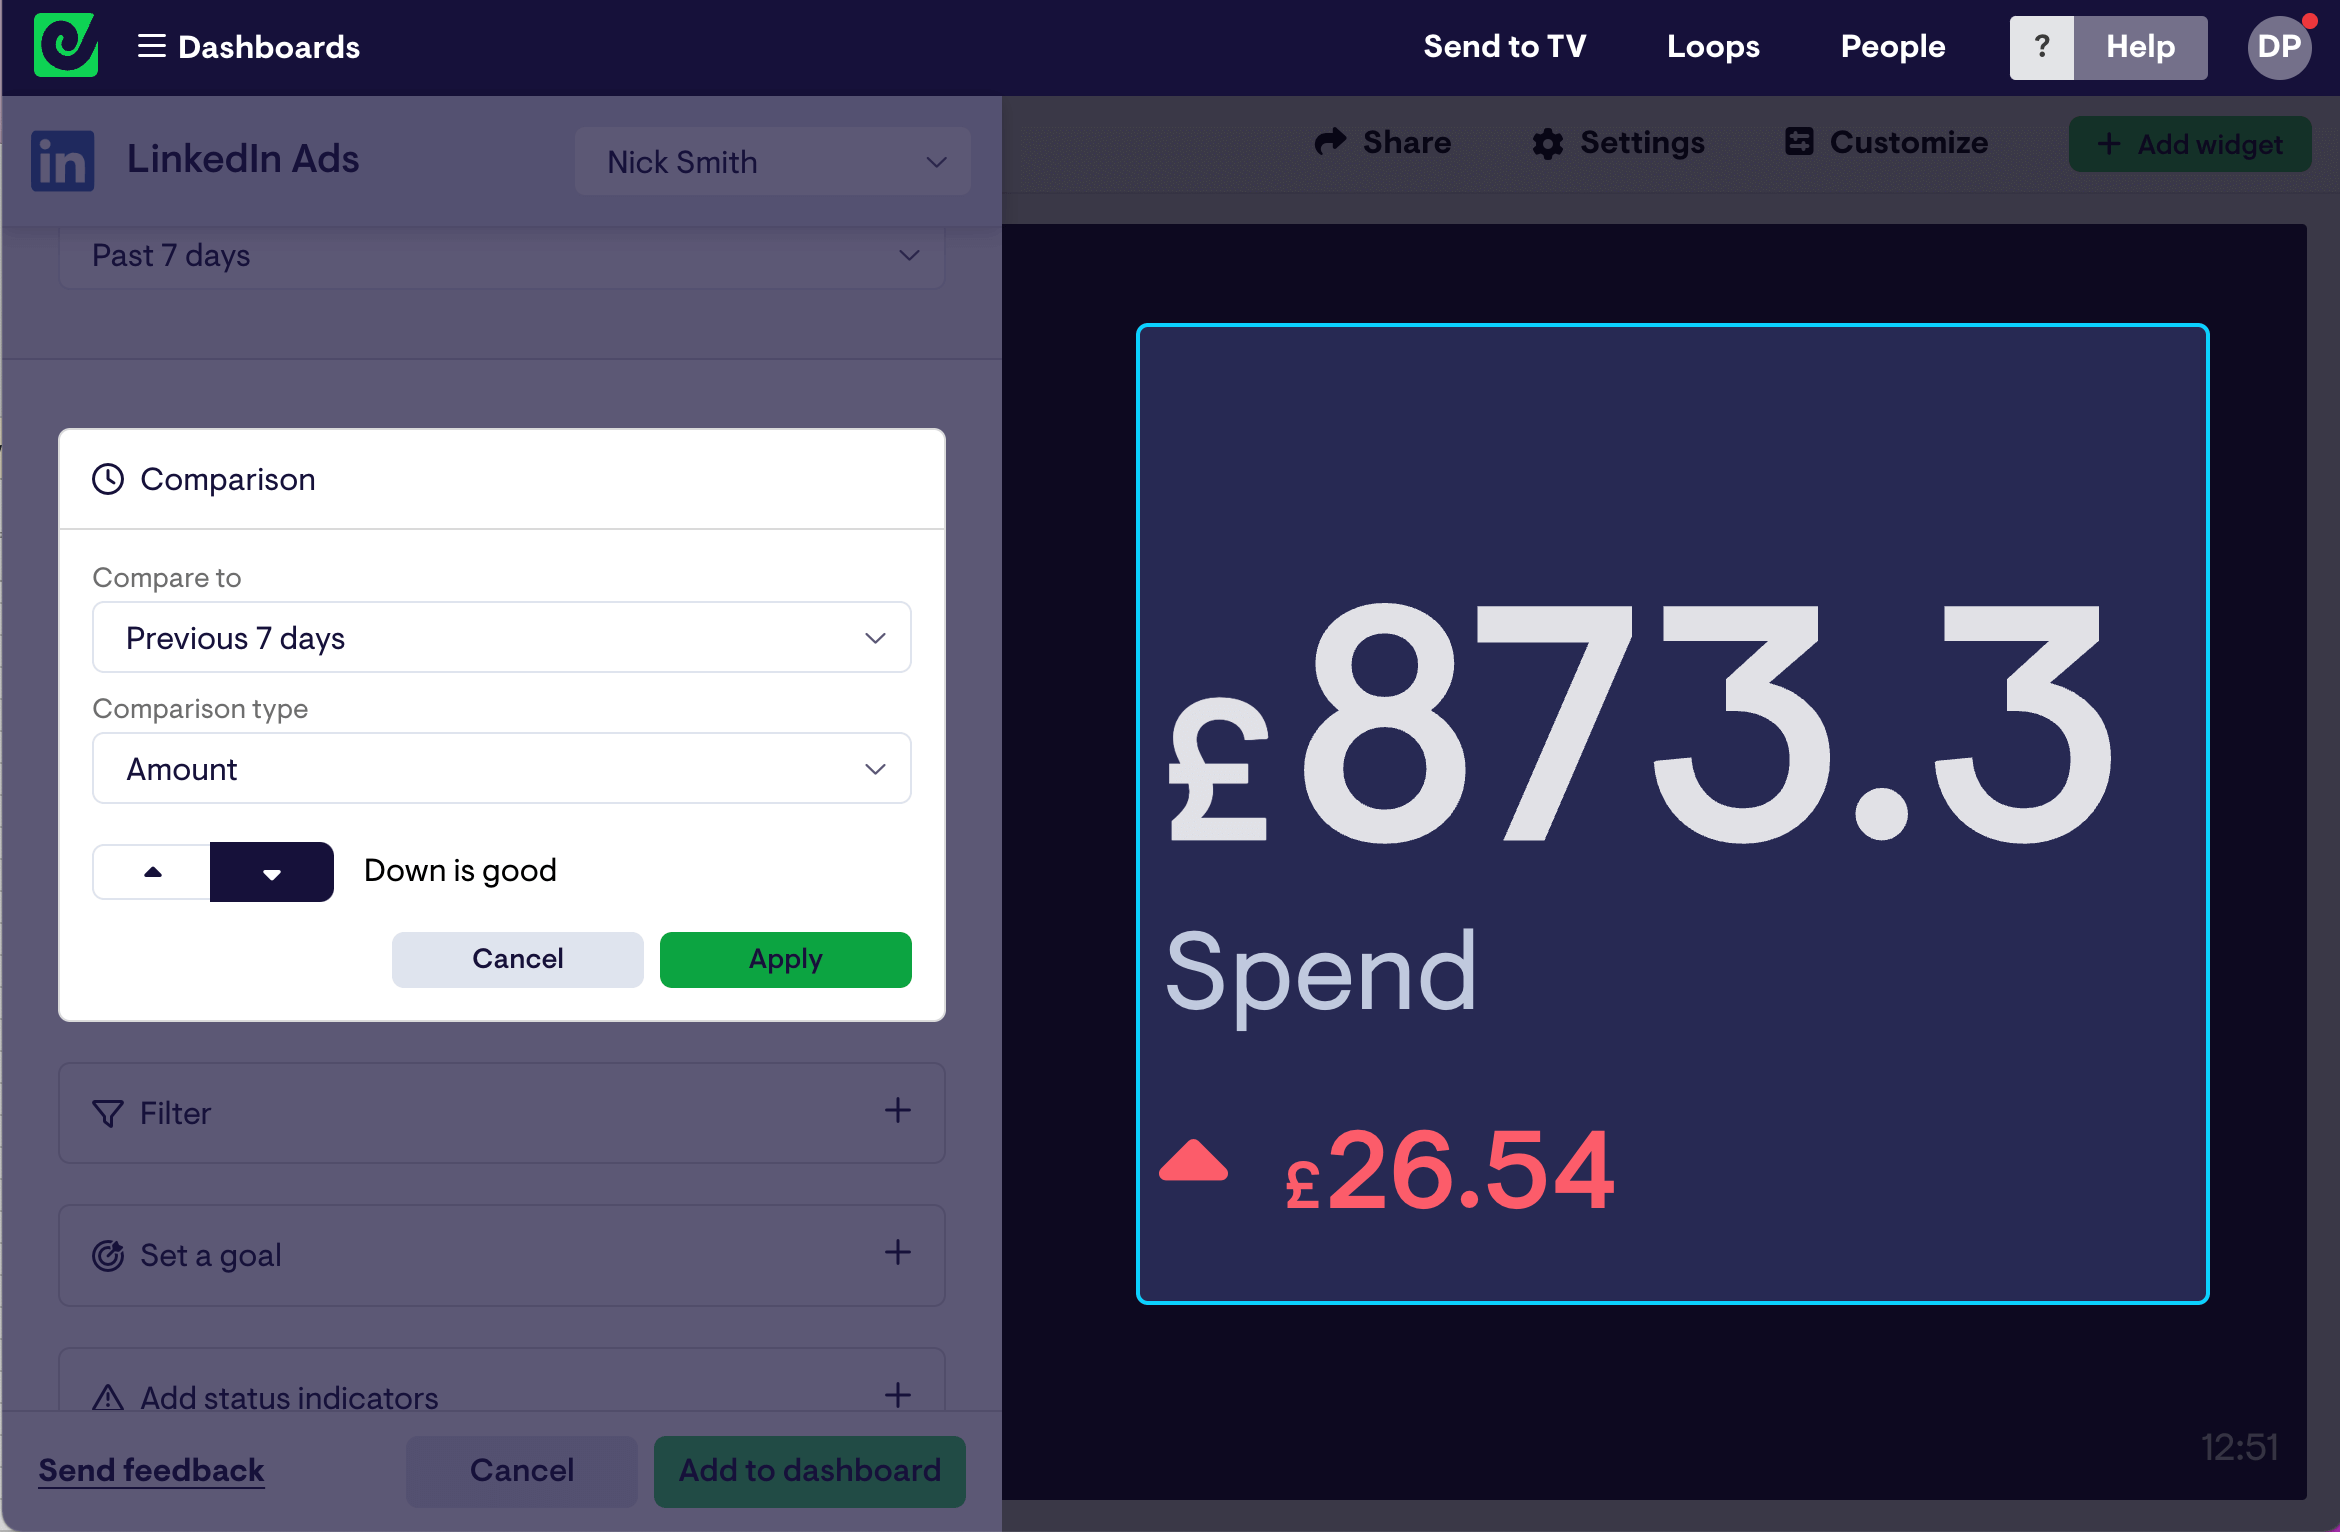
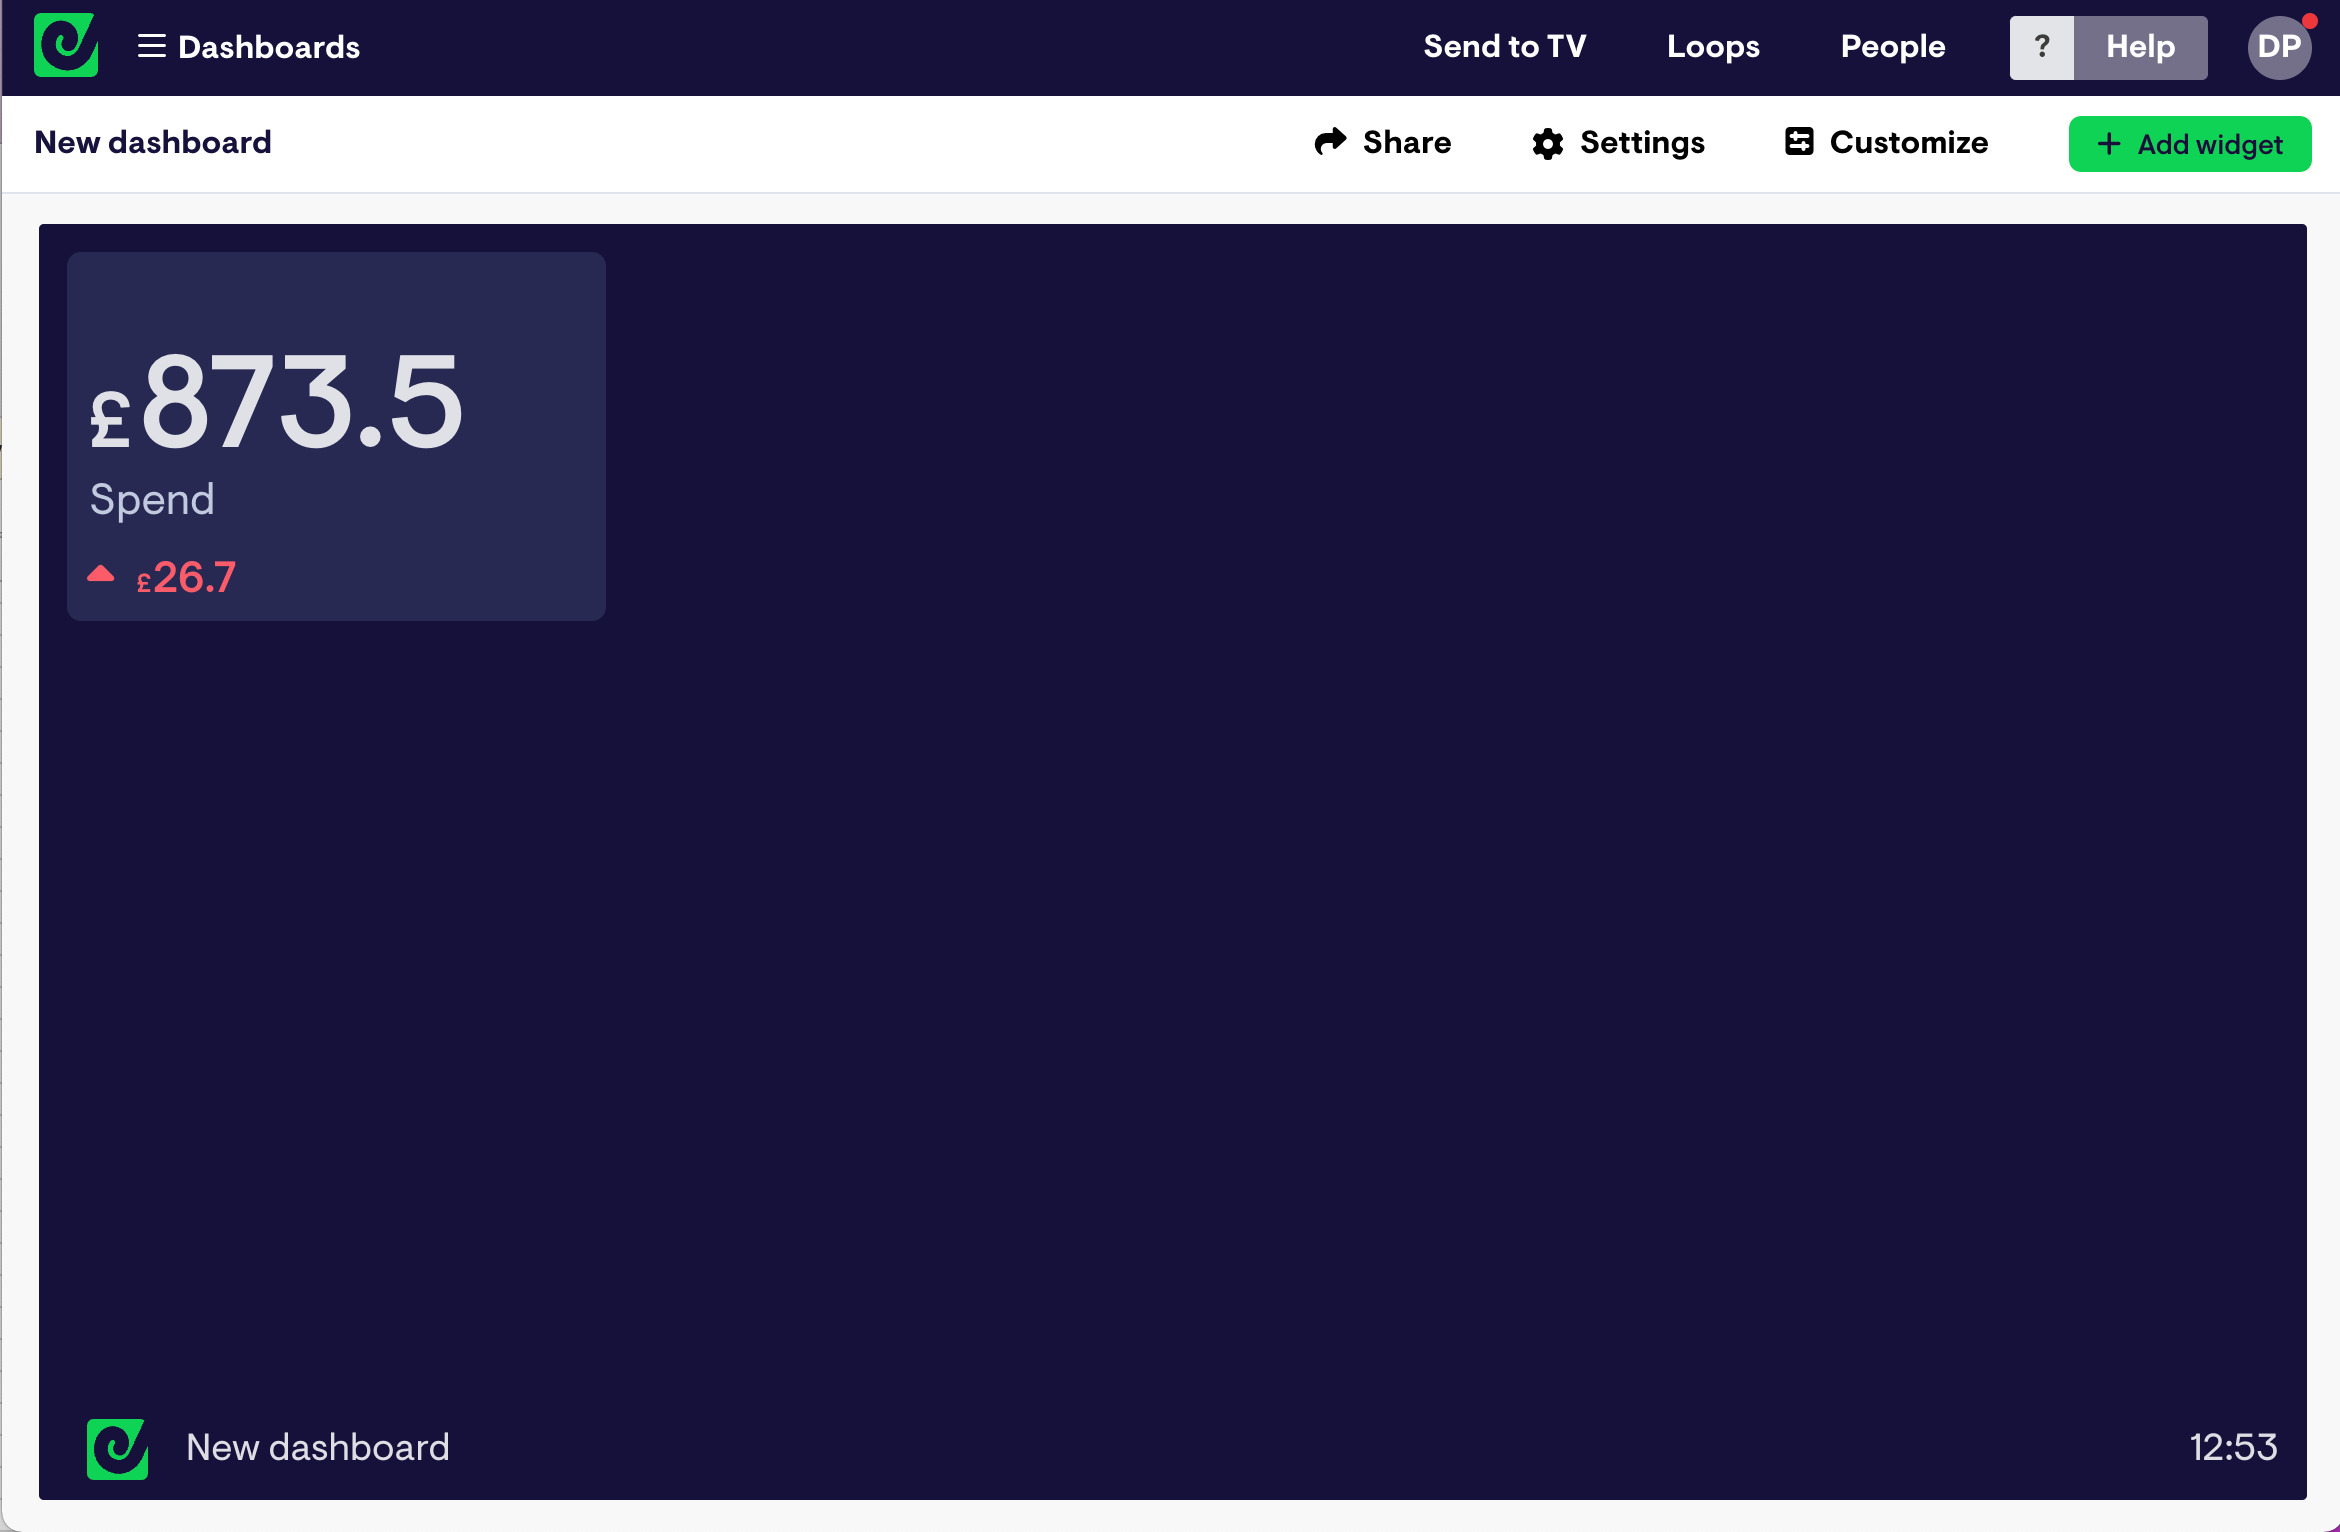
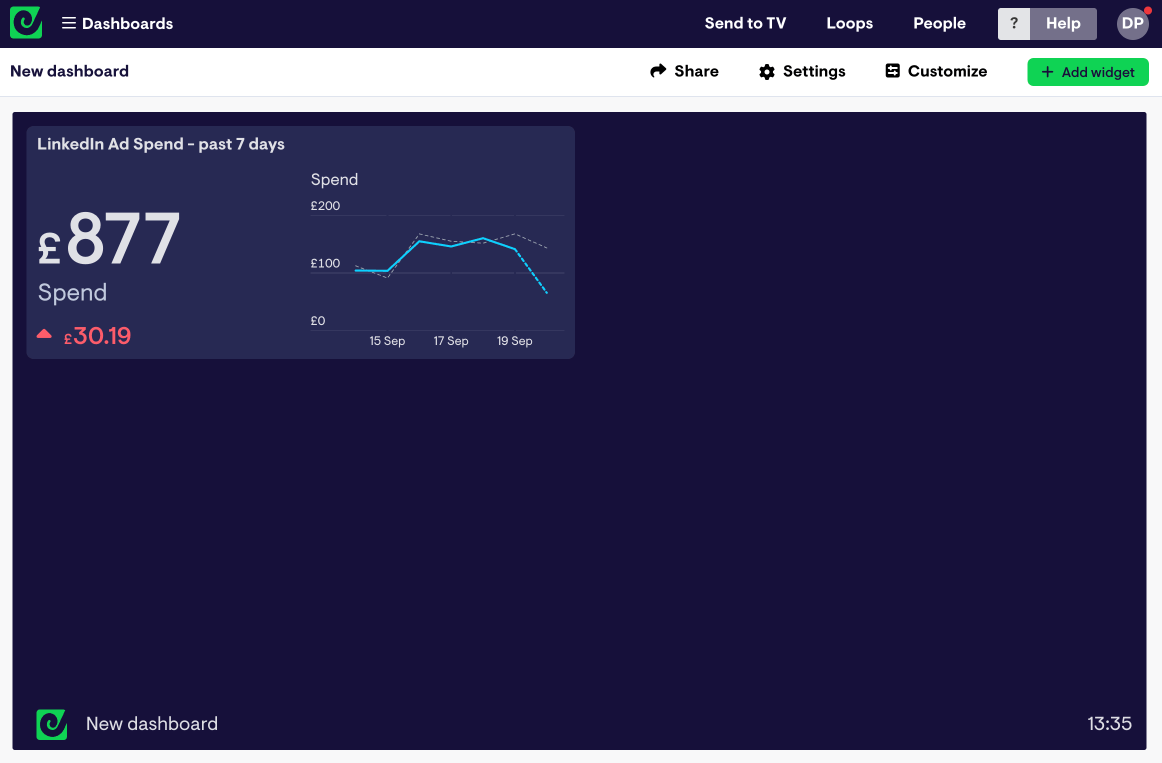
Now I’m happy with my widget. I'm going to add it to my dashboard.
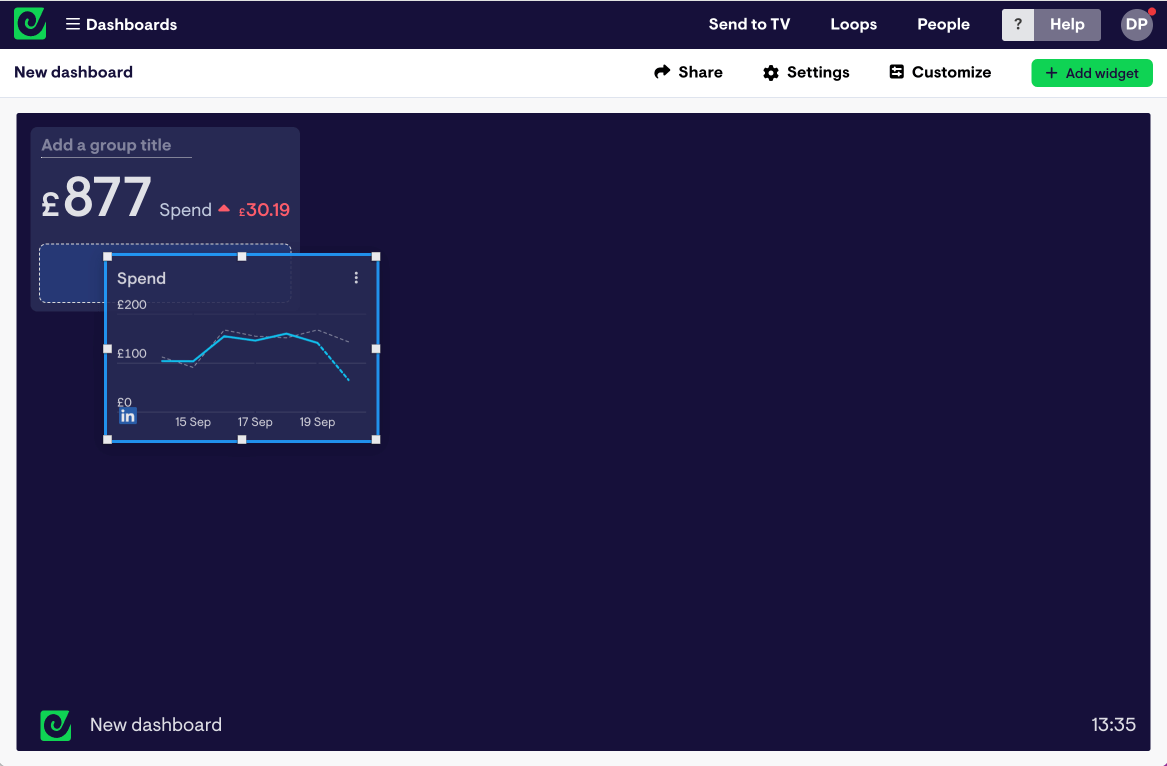
Step 4: Add another widget and group them
As well as visualizing our overall spend, I’d like to monitor how it’s changing day to day. So next, I’m going to create a line-chart that shows the weekly spend by day.
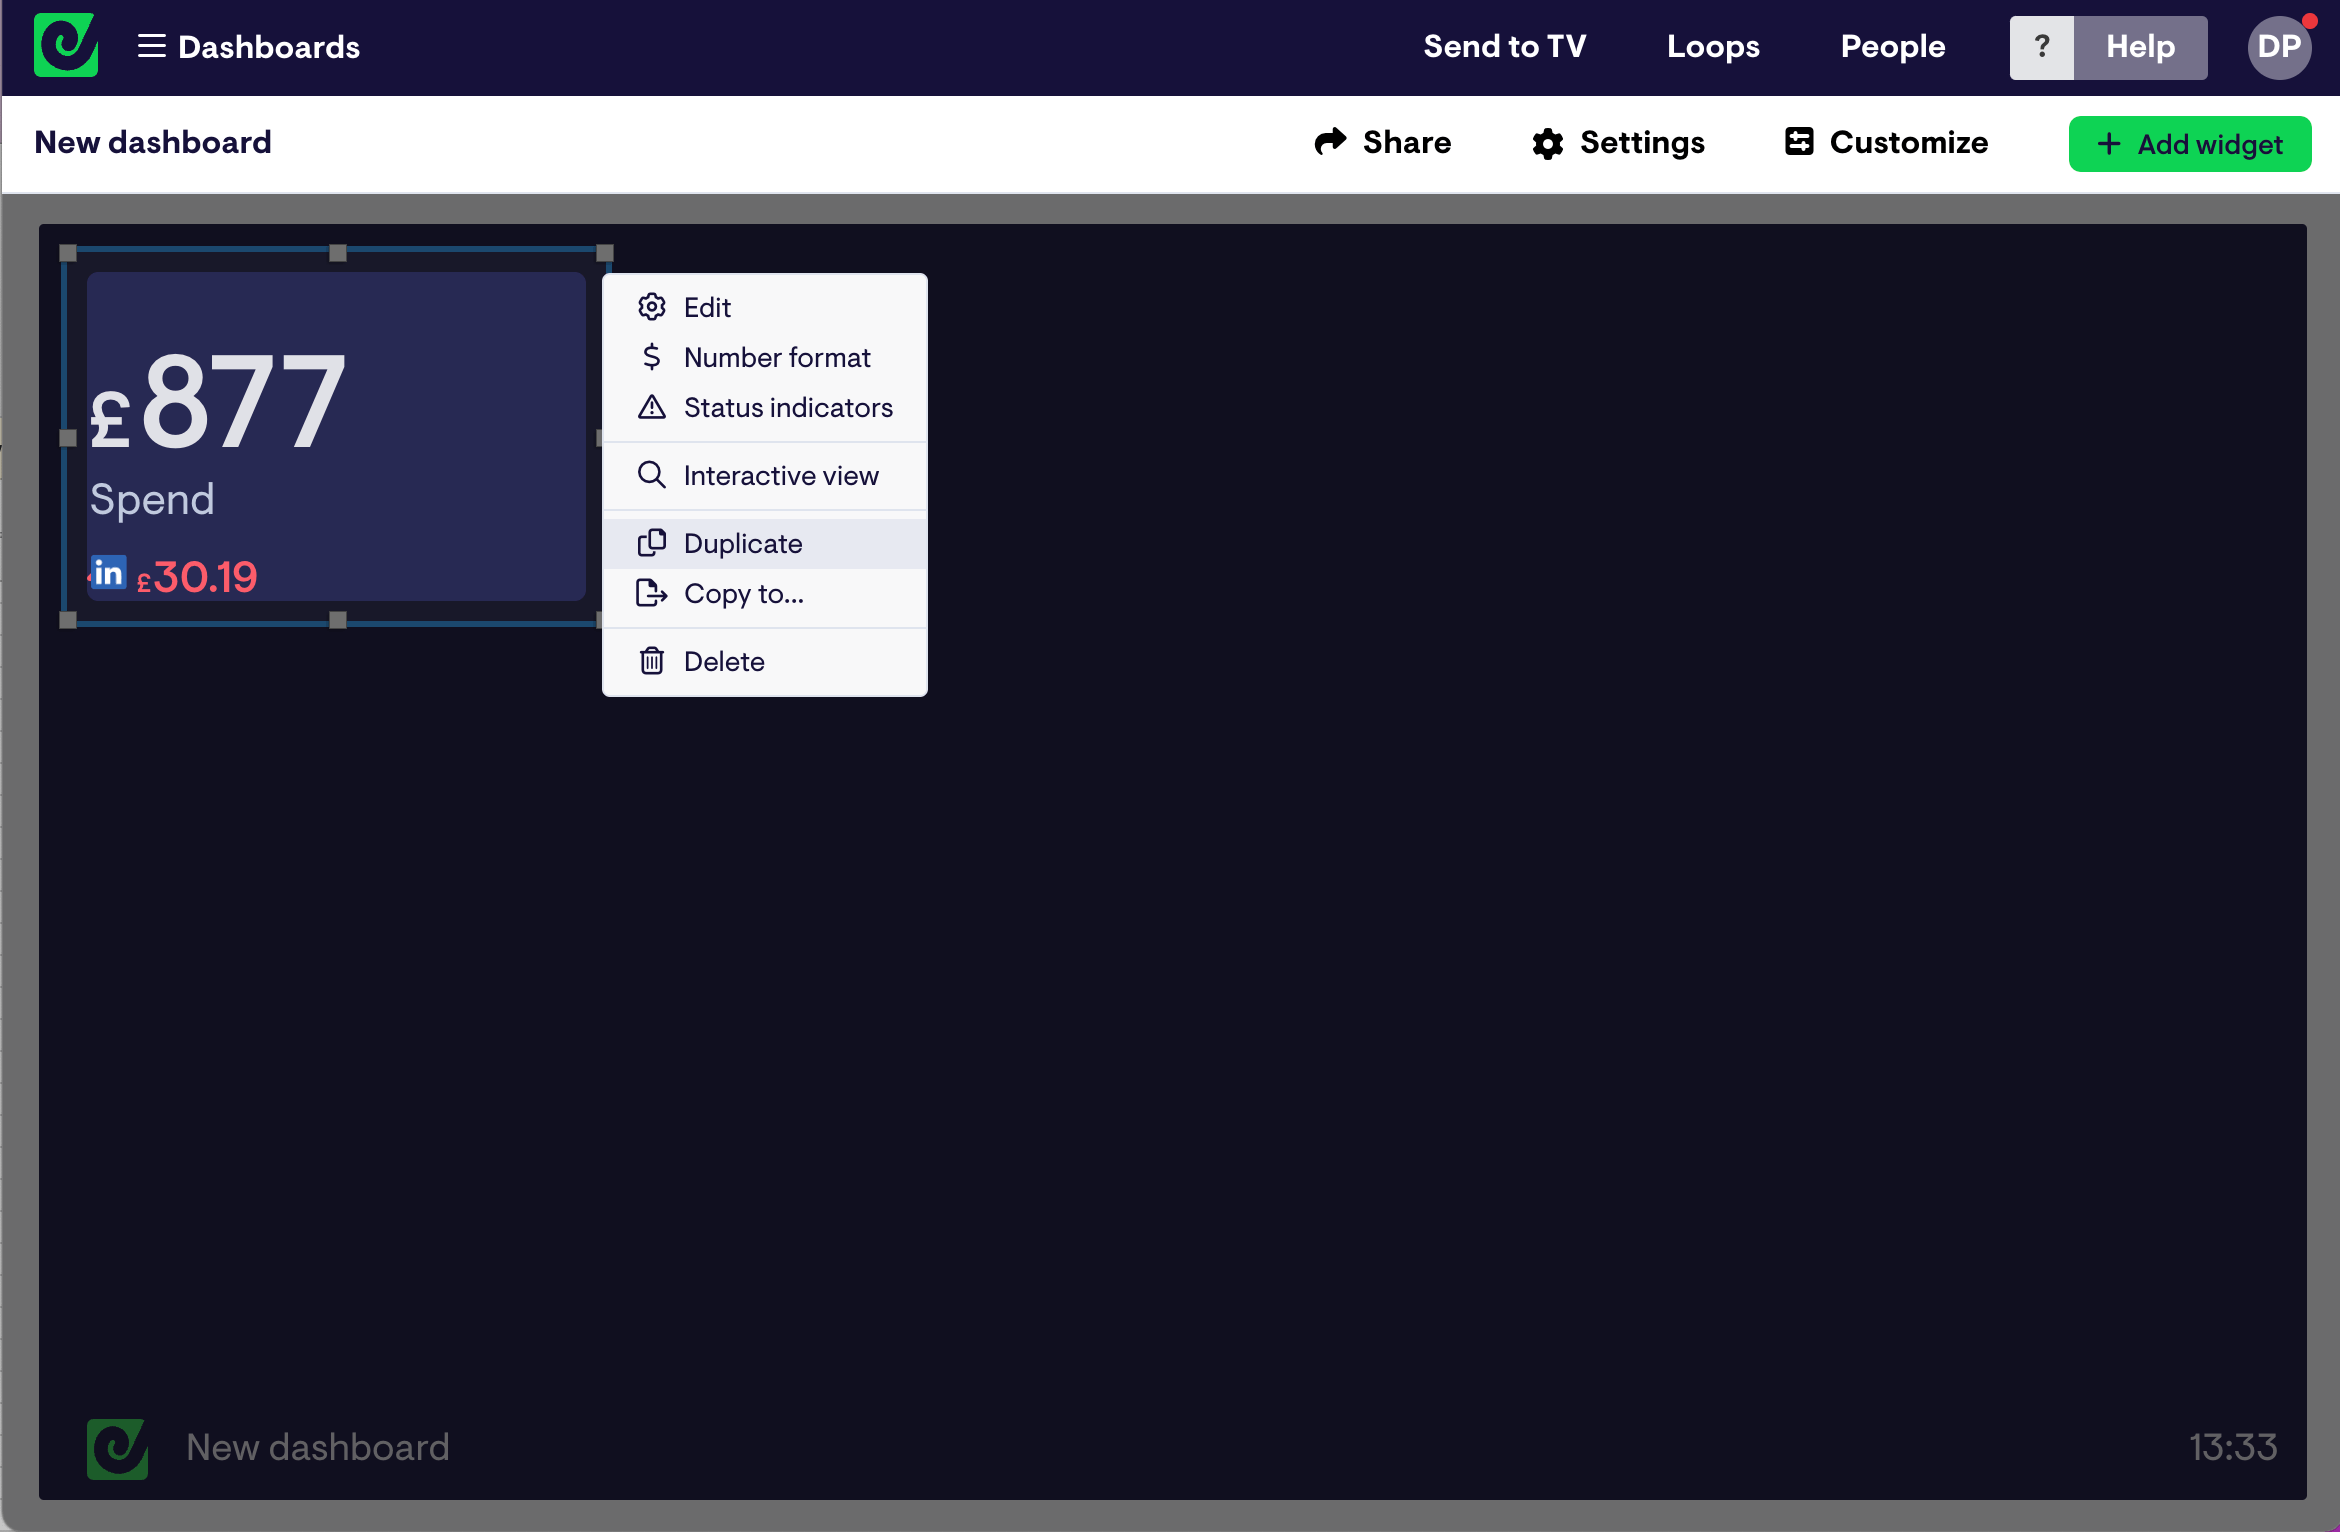
To do this, you can duplicate the existing widget then edit it to visualize as a line chart.
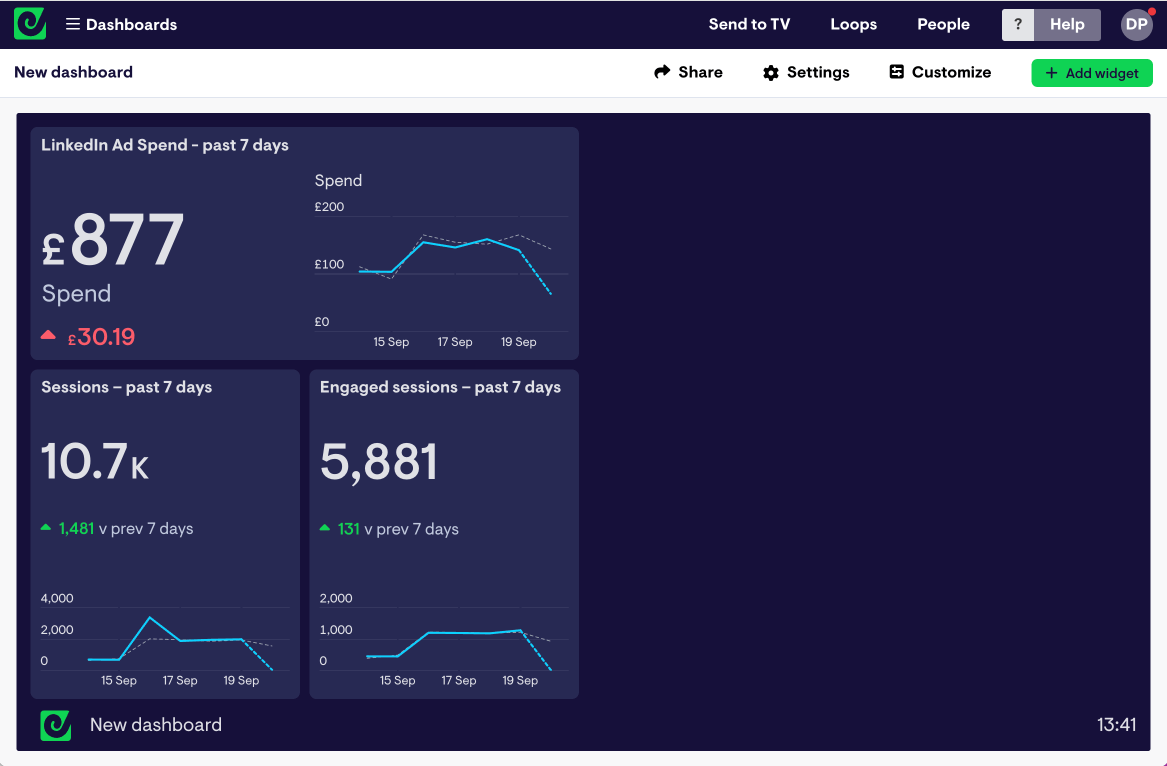
After adding it to the dashboard, you can group related widgets together, resize them and add a title like in the images below.
Step 5: Add Google Analytics widgets
Next, I’m going to repeat the exact same process to add data from Google Analytics.
- Click 'Add widget'
- Select Google Analytics 4 from the data source menu
- Connect your account
- Then build a widget
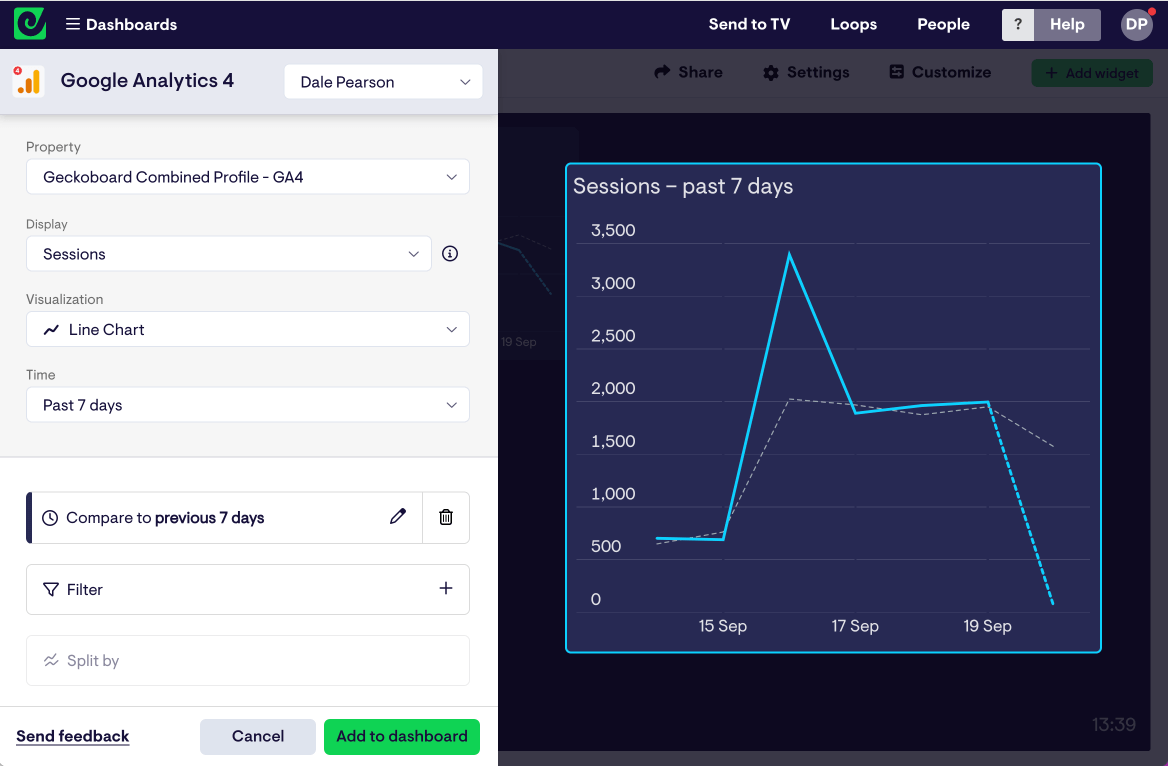
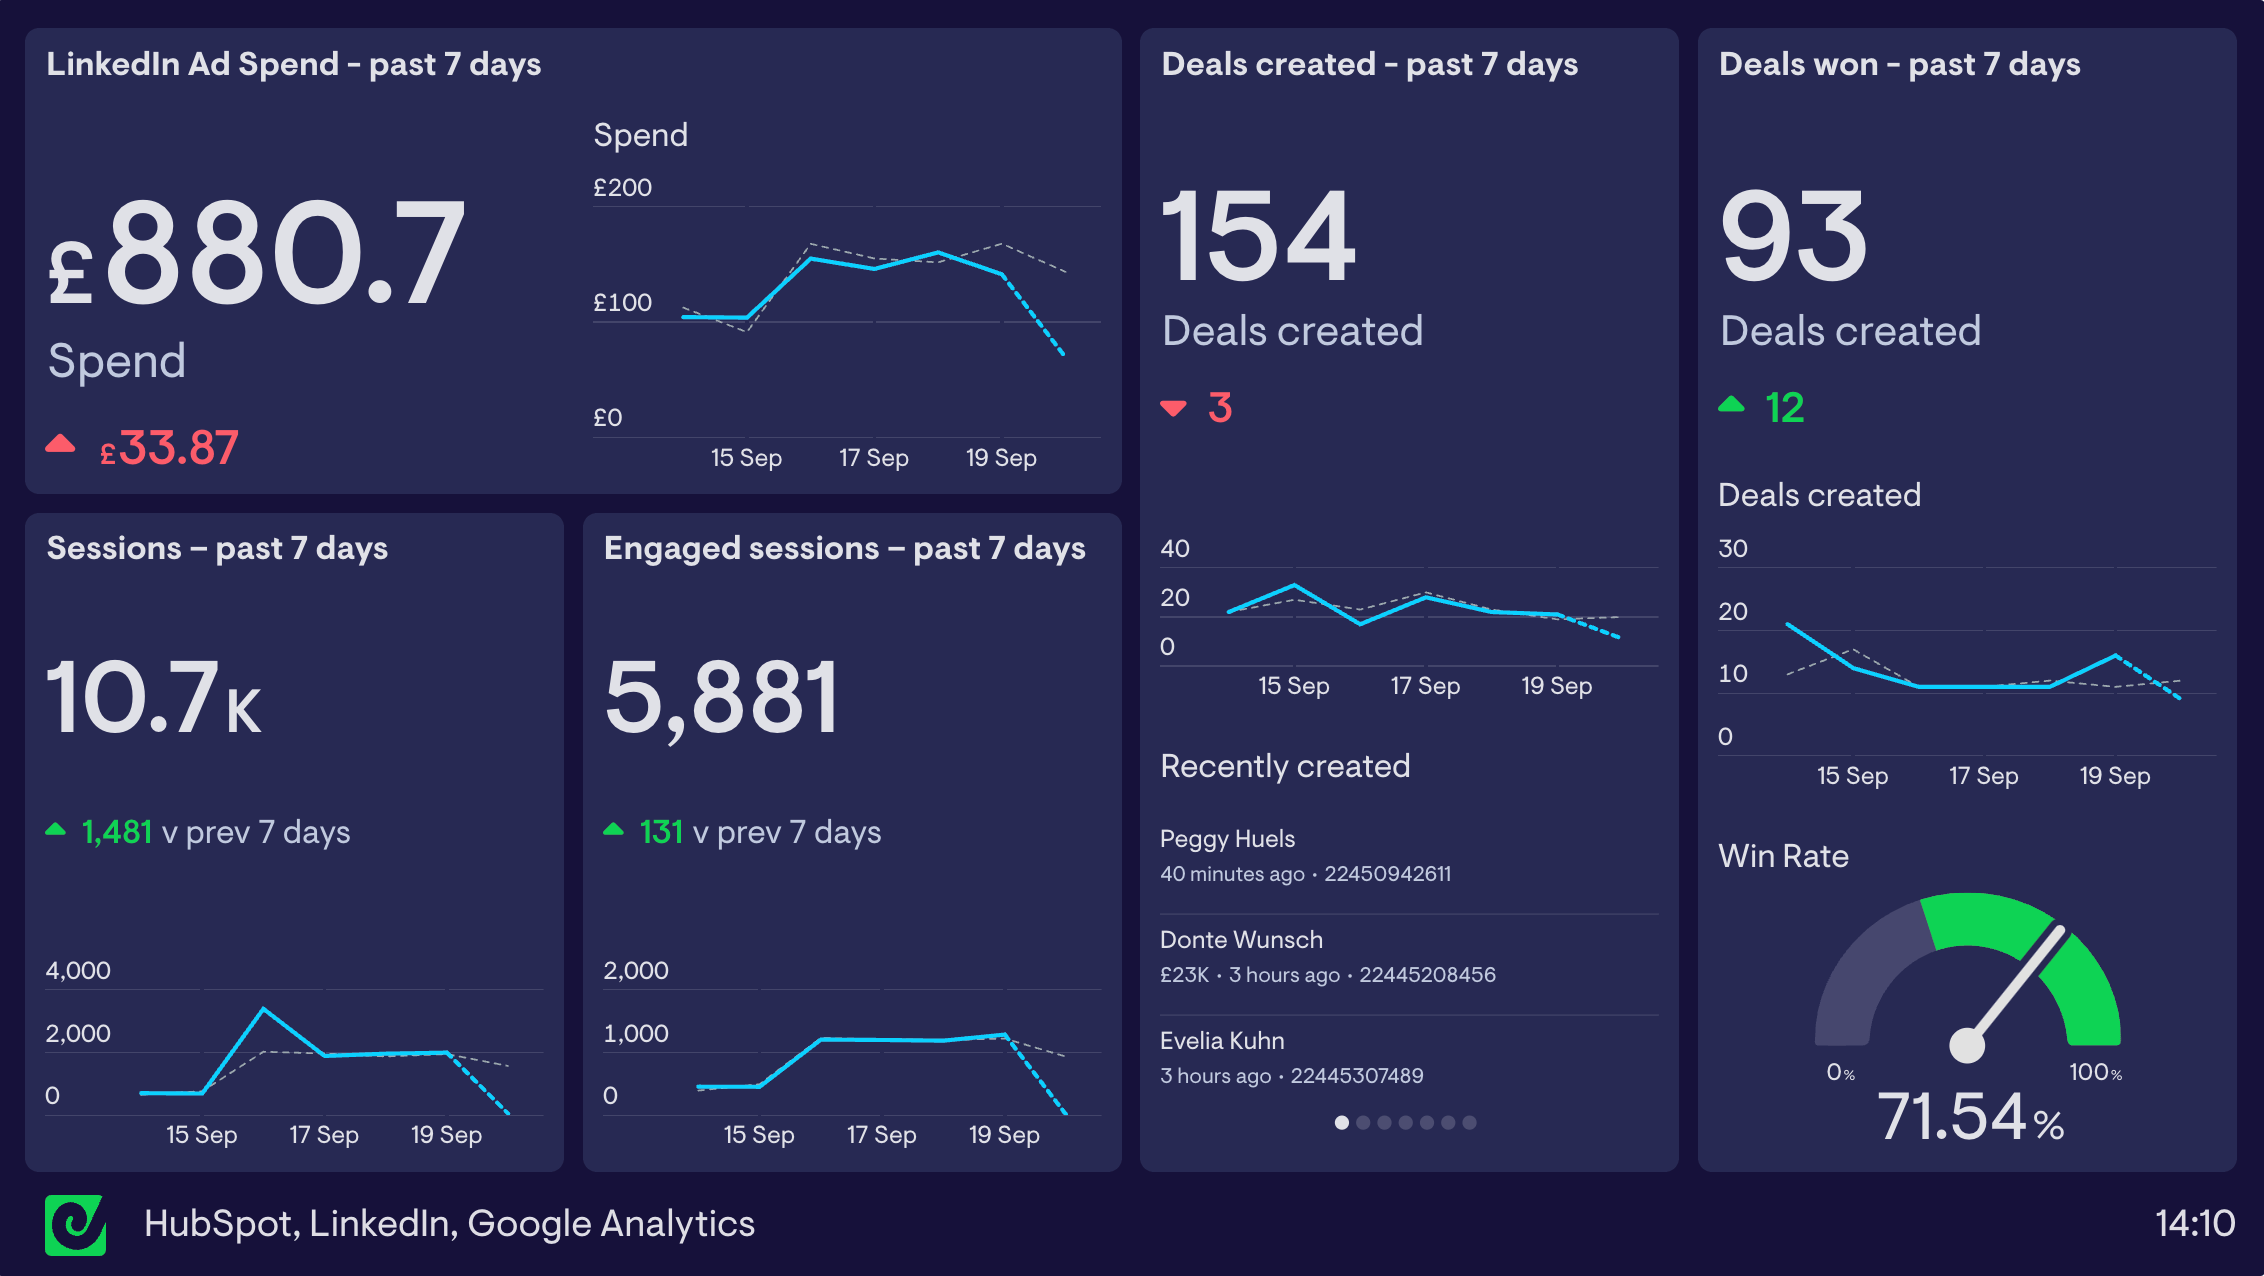
As you can see, I’ve created two groups of two widgets. One group to track the overall number of sessions on the website over the past seven days, and one group to track the number of engaged sessions over the past seven days.
Step 6: Add HubSpot widgets
Next, I’m going to repeat the exact same process to add data from my HubSpot account.
- Click 'Add widget'
- Select HubSpot from the data source menu
- Connect your account
- Then build a widget
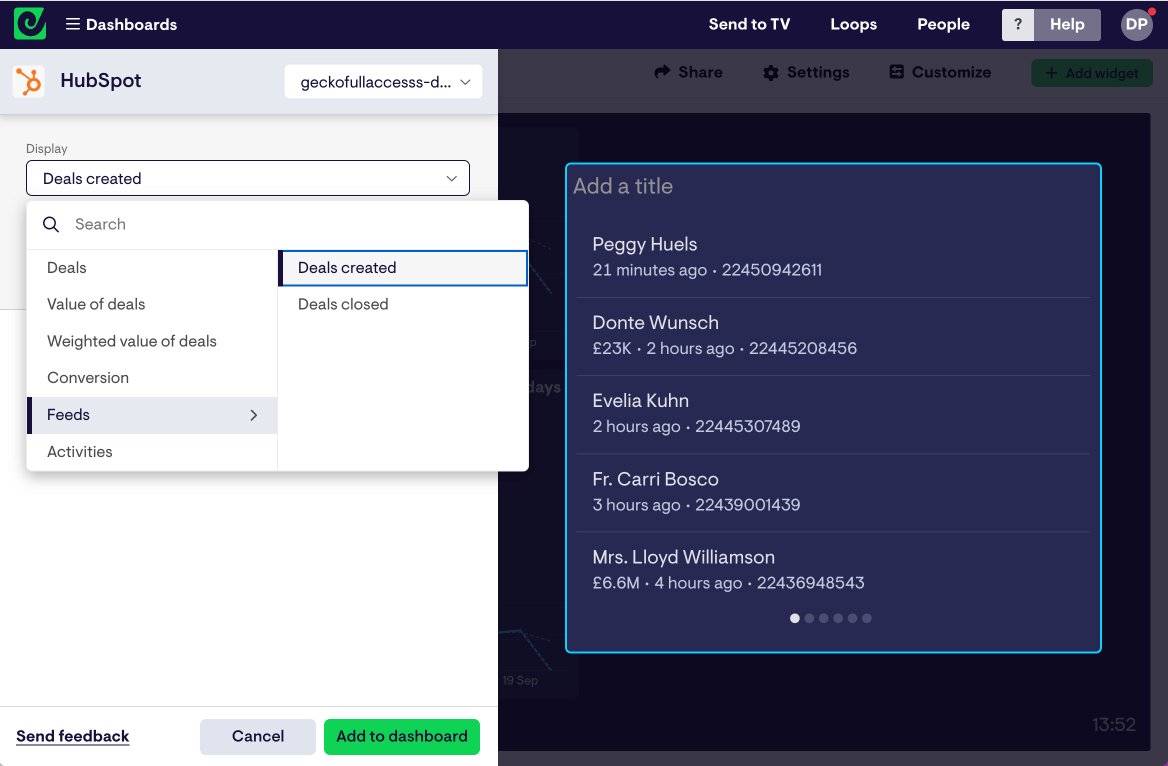
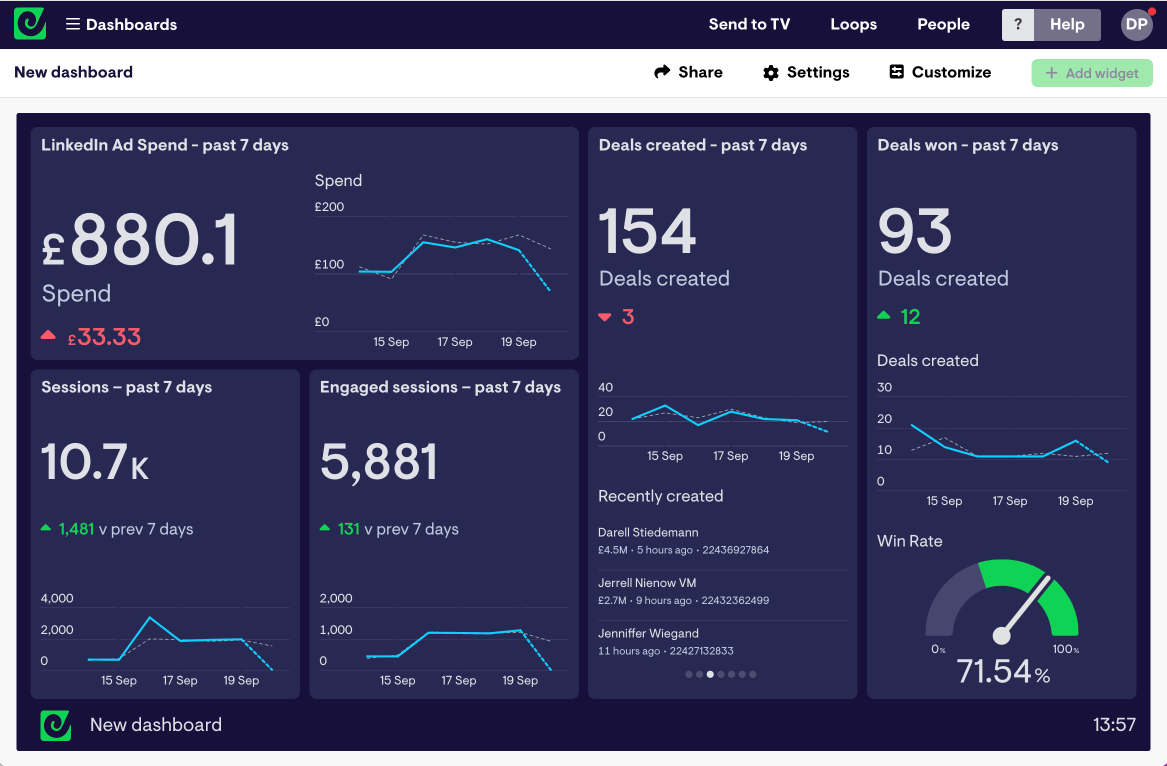
By selecting ‘Feeds’ from the display menu, I can create a live feed of all our recently created (or recently closed) deals, which is great for keeping teams in the loop, and starting conversations.
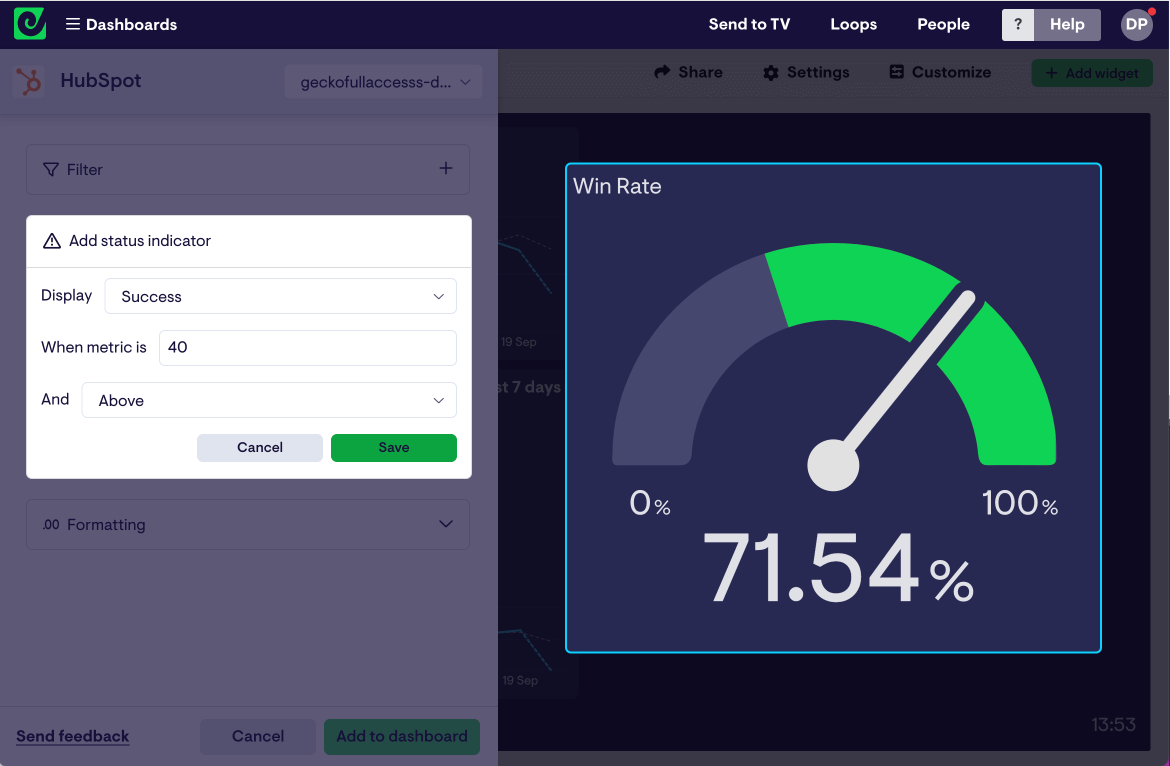
I’ve also built a widget that visualizes our Win Rate using a gauge visualization. By adding a status indicator, I can show that anything above 40% is positive.
Step 7: Share your dashboard
Once you’ve built your dashboard, it will auto-refresh in real time. You can create a sharing link to share your dashboard with colleagues. Or if you really want your team to engage with their KPIs, why not display it on a TV screen using our Send to TV feature?
Either way, you can relax knowing you have saved yourself countless hours spent producing manual reports. And all for a few minutes work.
