Managing sales data from different platforms can be challenging, but Geckoboard makes it easy to visualize sales metrics from tools like Aircall, HubSpot, Intercom, and Zapier all in one place. With Geckoboard, you can track these sources on the same sales dashboard or, if it works better for your team, create separate dashboards that focus on specific areas.
This flexibility allows you to monitor exactly what you need, whether you prefer a unified view or detailed insights across multiple boards.
In this guide, we’ll walk you through setting up a sales data dashboard that integrates Aircall, HubSpot, Intercom, and Zapier metrics. We’ll also discuss how to create multiple dashboards for more specific reporting if that’s the better option for your team.
Step 1: Connect your data sources in Geckoboard
Start by connecting your various data sources to Geckoboard. Here’s how to link each account:
- Log into Geckoboard: Sign in or create a Geckoboard account if you don’t have one yet.
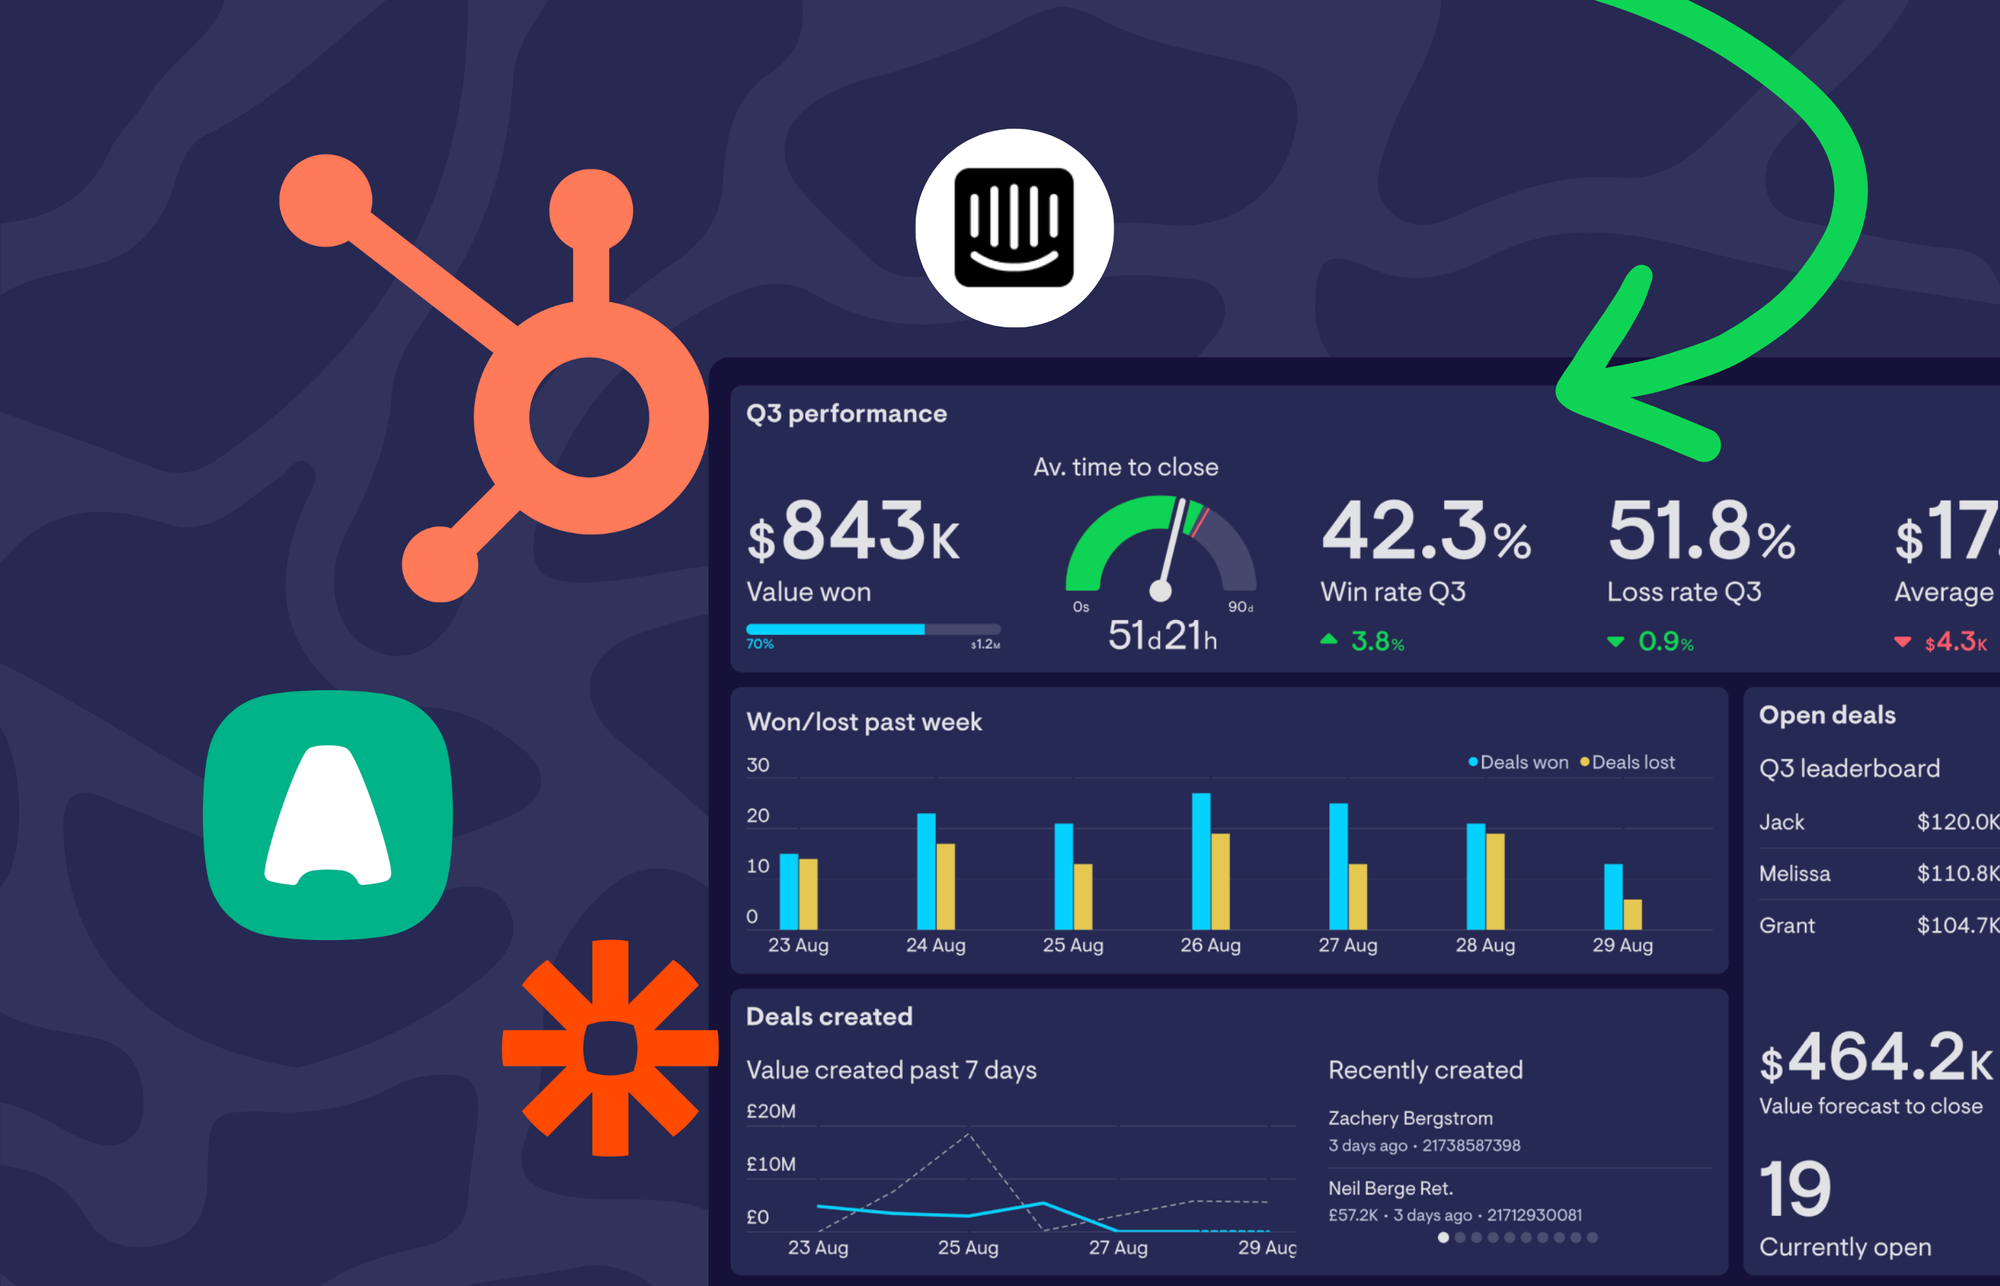
- Connect HubSpot: From the ‘Data Sources’ section, select HubSpot and follow the prompts to connect your account. You’ll be able to pull in key sales metrics like deal stages, lead conversions, and total revenue.
- Connect Aircall: Similarly, select Aircall in the ‘Data Sources’ section. This integration allows you to track call volume, duration, and response times; important metrics for understanding your sales team’s phone performance.
- Connect Intercom: Add Intercom as a data source to visualize customer conversations and support metrics, such as chat response times and resolution rates.
- Connect Zapier: Lastly, integrate Zapier to track how many workflows are running, how successful they are, and how automation is impacting your sales processes.
Step 2: Set up widgets for each data source
Now that your data sources are connected, it’s time to create widgets to visualize the key metrics from each platform:
- HubSpot widgets: Track essential metrics like deal stages, conversion rates, and closed deals. This data is critical for monitoring your sales pipeline in real time.
- Aircall widgets: Create widgets to visualize call volume, call duration, and average response times, which are key indicators of your team's outreach efforts.
- Intercom widgets: Use Intercom widgets to track customer conversation data, like how quickly issues are resolved and how many inquiries are coming in through live chat.
- Zapier widgets: Set up widgets that show how many automations Zapier is running and how efficient they are at helping your team streamline workflows.
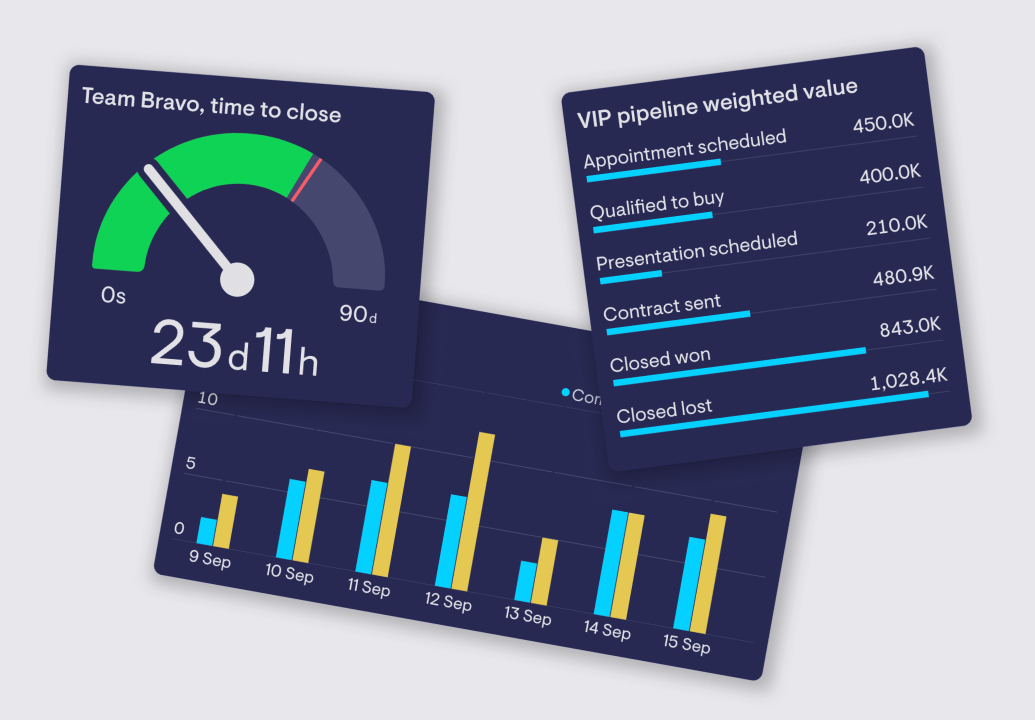
Step 3: Customize your dashboard layout
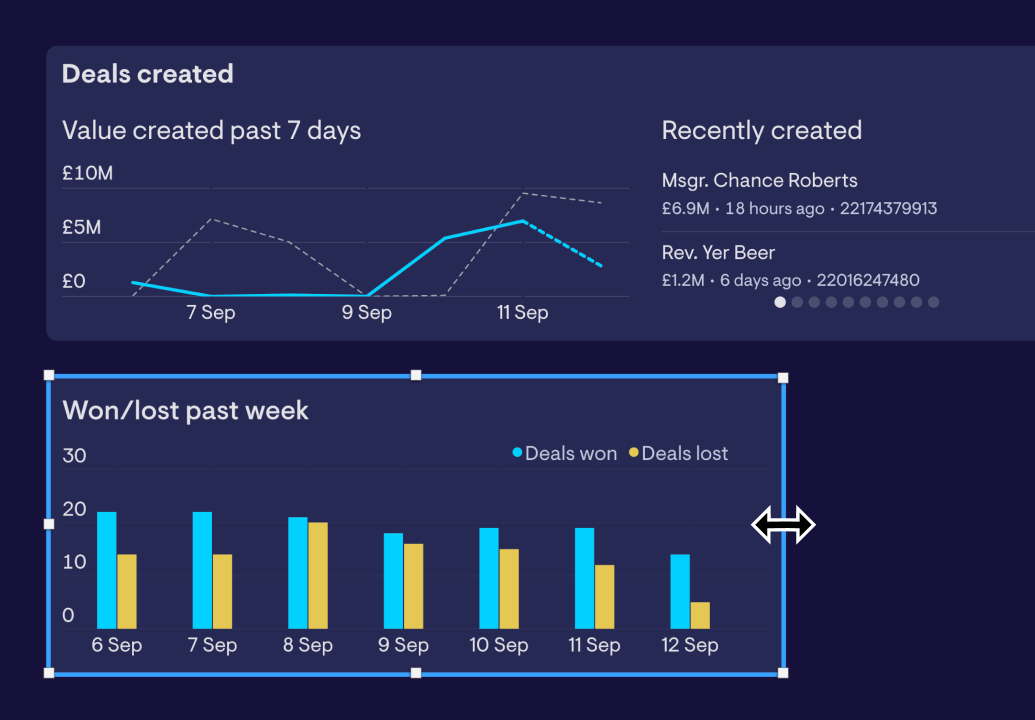
Whether you decide to track all your data on a single dashboard or split it into multiple dashboards for more focused insights, Geckoboard allows for easy customization.
- Single dashboard for a unified view: If you prefer an all-in-one approach, arrange widgets from Aircall, HubSpot, Intercom, and Zapier on the same dashboard to get a holistic view of your sales activities. Group related metrics together to see how they influence each other, like comparing sales calls to deal closings.
- Multiple dashboards for specific insights: You might find it easier to separate data by platform or category. For example, one dashboard could focus solely on HubSpot metrics like deal stages and revenue, while another could track call activity from Aircall. This way, you can dive deeper into specific areas without cluttering a single dashboard.
- Tailor your layout: Geckoboard allows you to adjust widget sizes, colors, and layouts to make the most important data stand out. Consider organizing by priority, placing key performance indicators (KPIs) at the top of the dashboard for quick insights.
Step 4: Automate snapshot reports
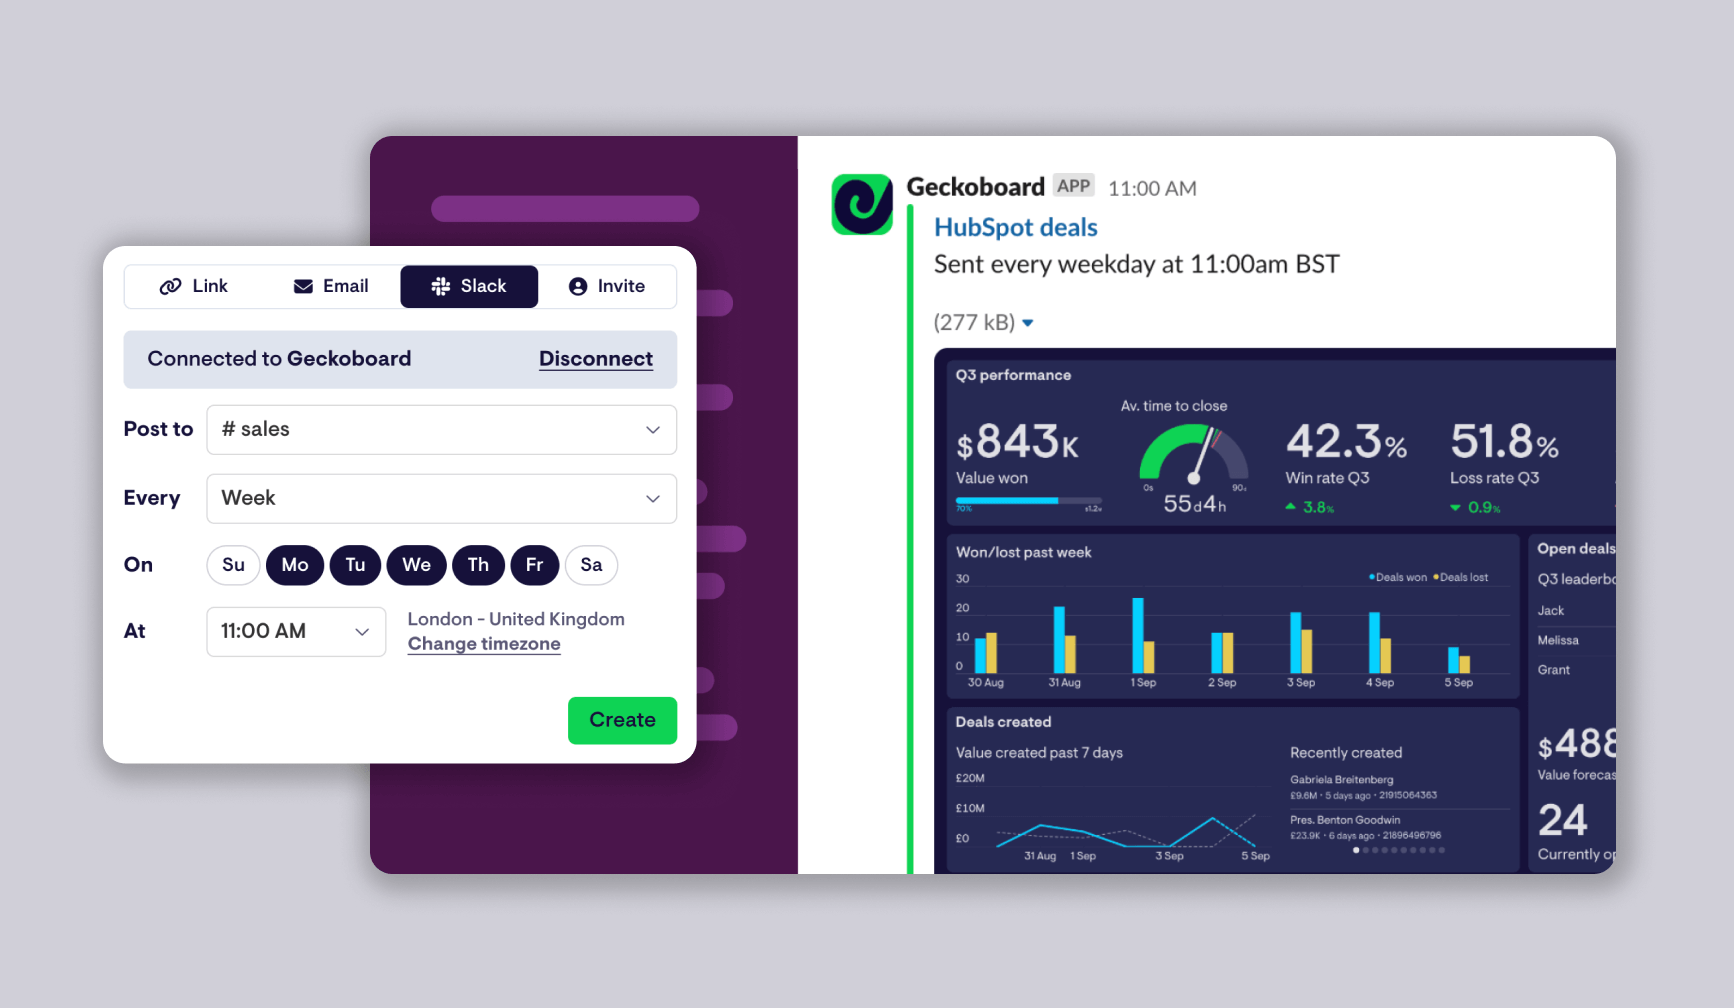
To keep your team updated without manually checking the dashboard, Geckoboard allows you to automate snapshot reports. Here’s how to set them up:
- Set daily snapshots for real-time sales data: For your sales team, automate daily snapshots to track call activity, deal stages, and customer interactions. This provides a quick overview of performance.
- Weekly and monthly snapshots for trend analysis: Use weekly or monthly reports to get a broader picture of how your team is performing over time. These reports can help track patterns in closed deals, customer inquiries, and workflow efficiency.
- Schedule snapshot reports for email: Set up automatic snapshots to be sent directly to your team’s inbox. This ensures everyone stays informed without needing to access the dashboard regularly.
Choose the right dashboard setup for your team
With Geckoboard, you have the flexibility to visualize sales data from Aircall, HubSpot, Intercom, and Zapier on a single sales data dashboard or create separate dashboards to drill down into specific areas. Whether you need an all-in-one view of your sales operations or prefer dedicated dashboards for more focused insights, Geckoboard allows you to tailor your setup to what works best for your team.
Ready to see how Geckoboard can simplify your data tracking? Start a free trial today and experience firsthand how easy it is to visualize and monitor all your sales metrics in one place.
