We all know HubSpot has some excellent reporting features for visualizing your key sales data.
But what happens when you want to create dashboards and reports that visualize data from multiple HubSpot accounts?
Can you achieve this in HubSpot?
Unfortunately not. But never fear, in this article we’ll explore how you can use Geckoboard to visualize metrics from several HubSpot accounts in a single dashboard.
Why might you need to report on multiple HubSpot accounts?
There are many reasons why you might need to report on several HubSpot accounts simultaneously.
- You’re a HubSpot consultant, and want to monitor several clients’ HubSpot accounts at once.
- You own more than one business and want to keep tabs on sales KPIs from both businesses in the same dashboard
- You operate several brands within the same business, which are operationally separate, with separate accounts.
In these situations, the only way to keep track of your metrics would be to continually log in and out of your different accounts. Fortunately, there is another way.
How to report on multiple accounts with Geckoboard
In the same way you can use Geckoboard to create a KPI dashboard that visualizes data from multiple sources (such as HubSpot, Linkedin, Zendesk and Google Analytics) – you can also use Geckoboard to create dashboards that visualize data from multiple accounts within the same data source.
That means you can build a custom dashboard that gives you all the information you need in a single glance.
And the best part is that Geckoboard auto refreshes its data sources in real-time, so you know your metrics will always be up to date.
Let’s explore how you can build your own multi-data source dashboard.
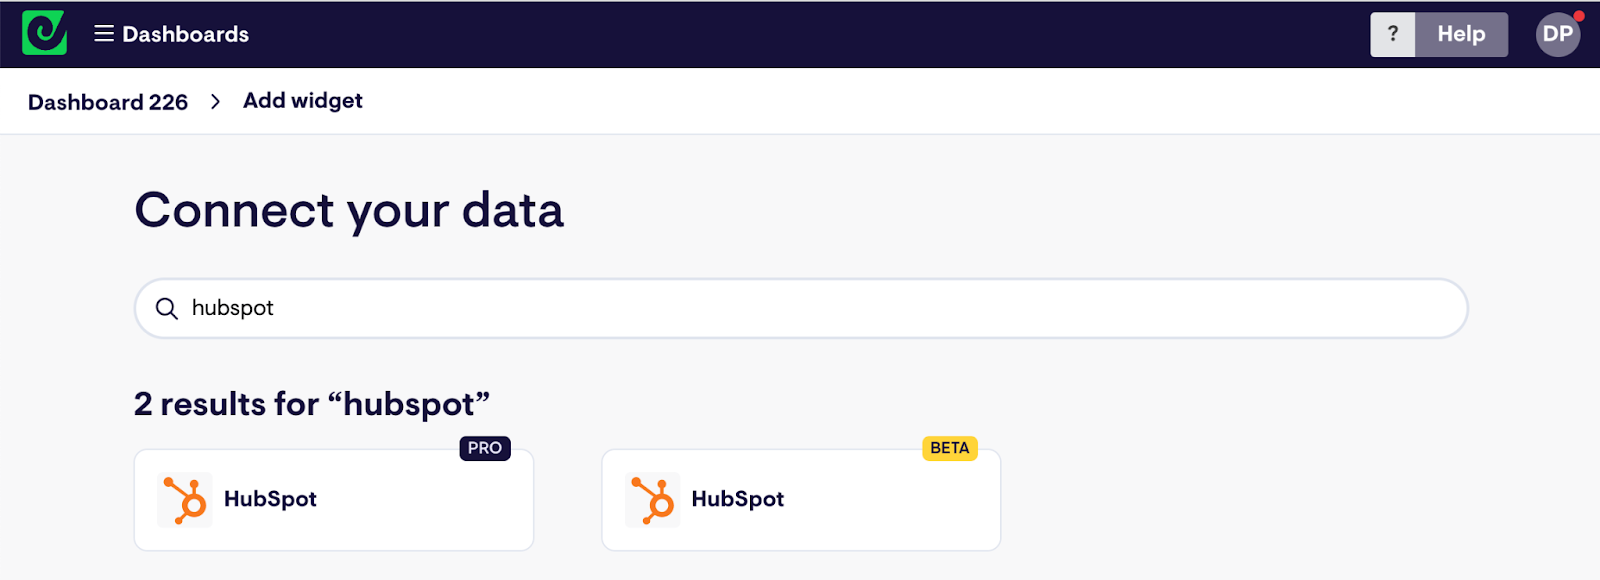
Step 1: Sign up to Geckoboard and connect your HubSpot account
Head to Geckoboard to sign up for a 14-day free trial. Next, start building your dashboard selecting the HubSpot data source.
Step 2: Build a widget using HubSpot data
Now you’ve connected HubSpot, you can start building widgets. A widget is just a type of data visualization – you can choose numbers, line charts, leaderboard, funnels or gauges.
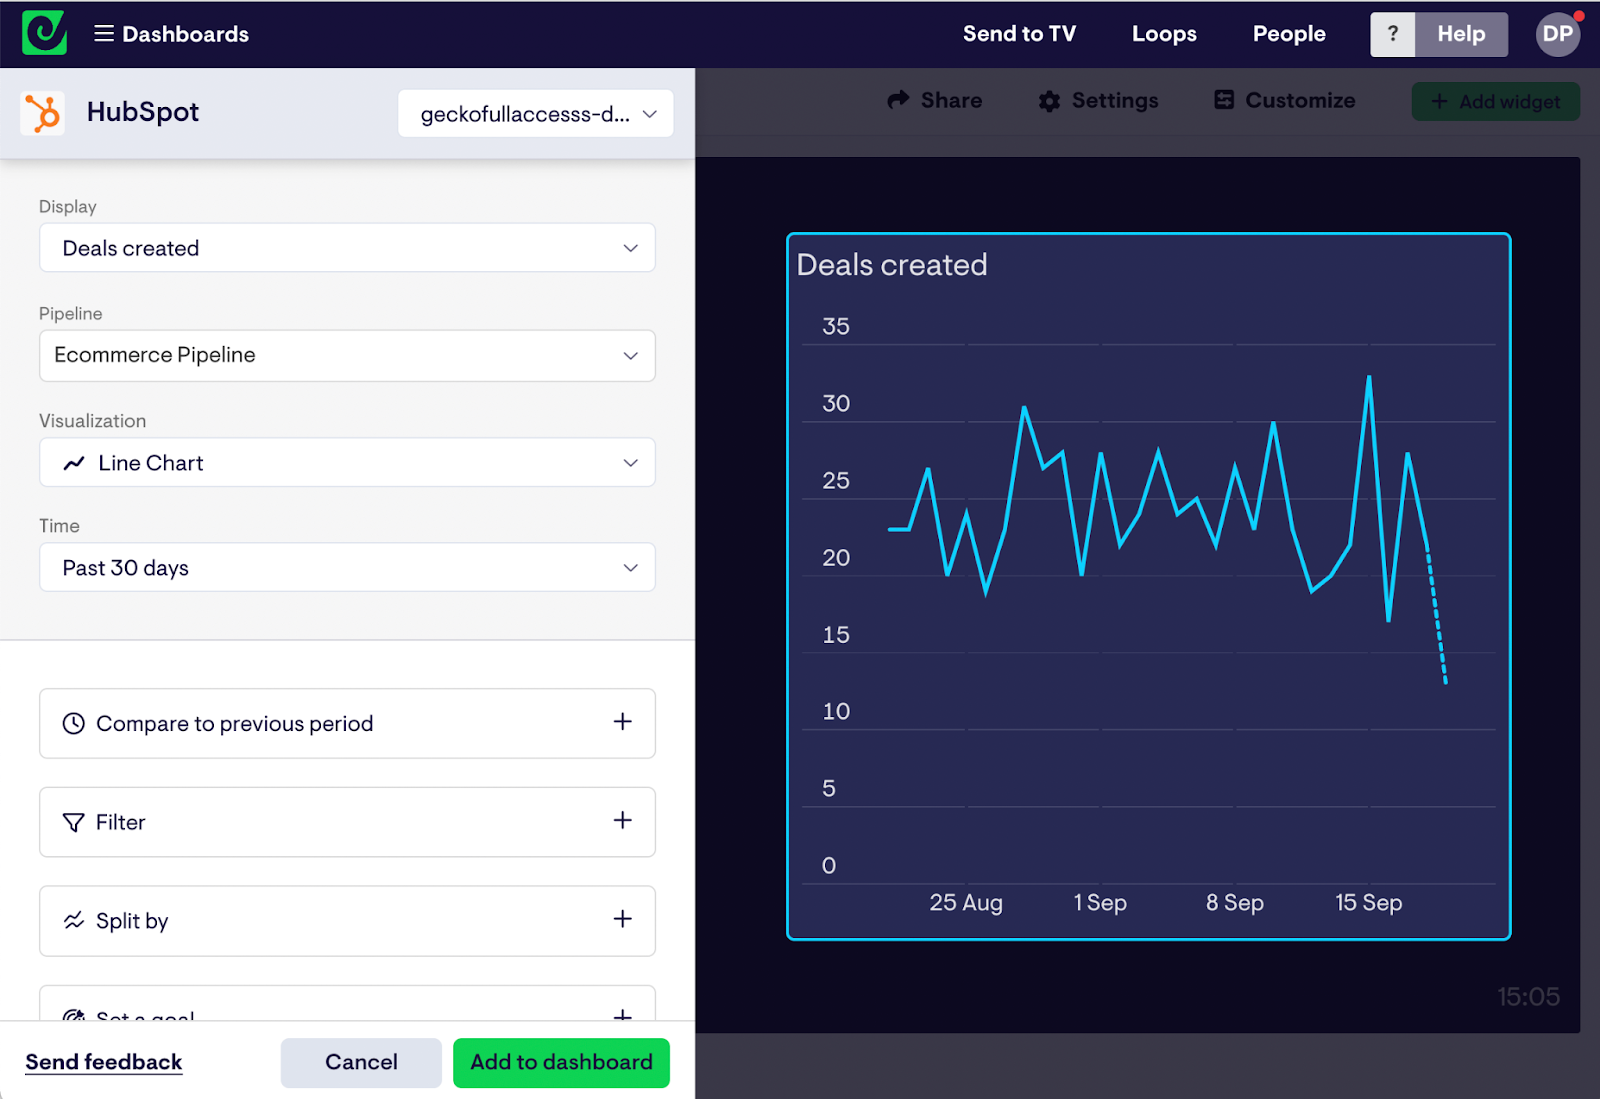
You can also add further context to your visualizations. For example, you might add a sales goal you are trying to reach, a comparison with a previous period. This helps the team quickly understand how to interpret the data on the dashboard.
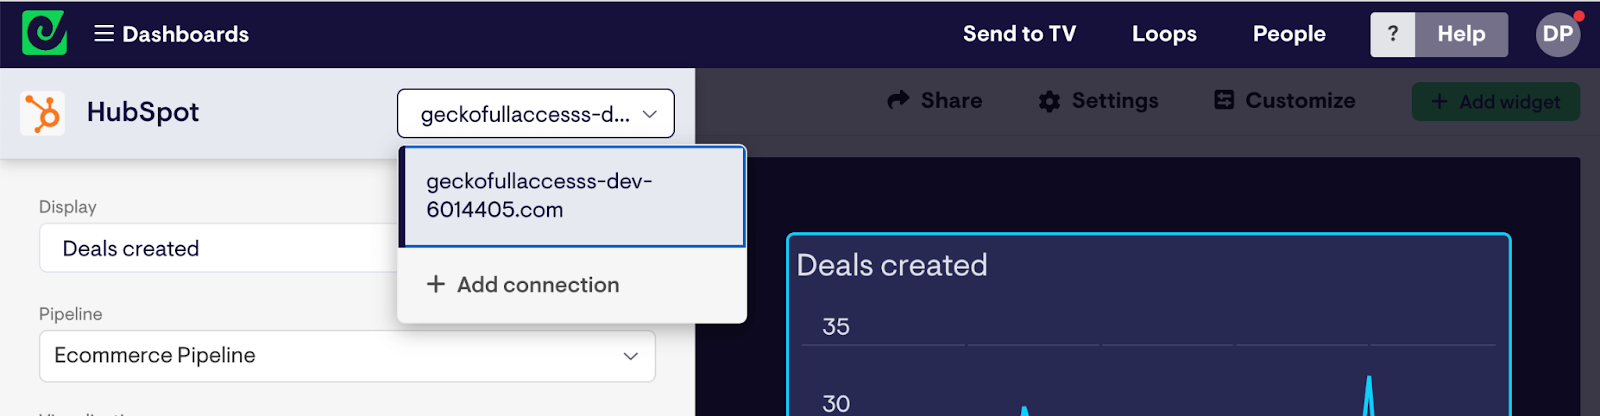
Step 3: Connect data from multiple HubSpot accounts
When you add a widget, you’ll notice there is a dropdown at the top left hand side of the screen where you can connect additional HubSpot accounts. Just click the drop down and select Add connection.
Step 4: Build up your dashboard by adding more widgets
Continue adding widgets until you’ve visualized all your most important data from across your different accounts. You might complete the picture by including visualizations from other data sources such as Google Analytics, Google Ads, LinkedIn, Facebook, Zendesk or Spreadsheets.
It’s easy to move, resize and group widgets using Geckoboard – it's just a case of "drag and drop".
Conclusion
And there you go. Now you can see all your HubSpot metrics in one place. No more spending all your time logging into different accounts.
