There are many situations in which you might need to monitor multiple Pipedrive accounts at the same time.
For example, you might own multiple businesses with their own, seperate Pipedrive accounts. Or you might be a technical consultant who is helping multiple businesses set up and maintain their Pipedrive platform. In this situation, it’s helpful to understand how much your clients are using the platform, to understand how well they are onboarding.
For obvious reasons, Pipedrive’s native reporting platform isn’t designed to let you report on metrics from other accounts, meaning you can’t create reports to track metrics from different accounts.
So if you want to avoid spending your day logging into multiple accounts or switching between admin users, you’re going to need a solution.
Fortunately, there’s a simple solution to this reporting problem – Geckoboard. It’s going to save you a lot of time, and help you maintain an overview of all your Pipedrive data.
How to report on multiple accounts with Geckoboard
Geckoboard is a KPI dashboard tool that helps you monitor your most important sales metrics in real-time. In addition to Pipedrive, it also connects to over 90 data sources such as HubSpot, Salesforce, Shopify, Zendesk Google Ads, Google Analytics, Facebook, Instagram and Google Sheets.
That means you can build real-time dashboards from multiple data sources. Using our drag-and-drop dashboard creator, the whole process takes just a few minutes.
The best part is, Geckoboard can connect to several accounts in Pipedrive, meaning you can access all your metrics all in one place.
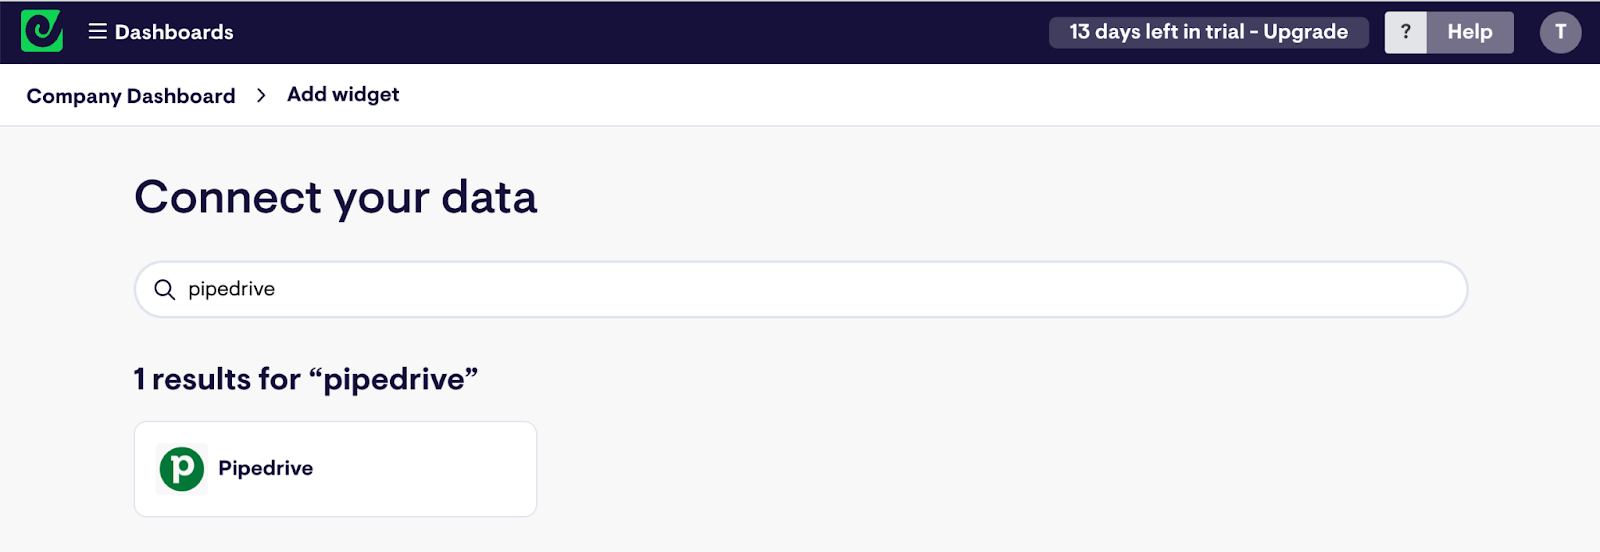
Step 1: Sign up to Geckoboard and connect your Pipedrive account
Head to Geckoboard to sign up for a free trial (you don’t need to enter any credit card details). Next, start building your dashboard selecting the Pipedrive data source.
Step 2: Build a widget using Pipedrive data
Now you’ve connected Pipedrive, you can start building widgets. A widget is just a type of data visualization – you can choose numbers, line charts, leaderboard, funnels or gauges.
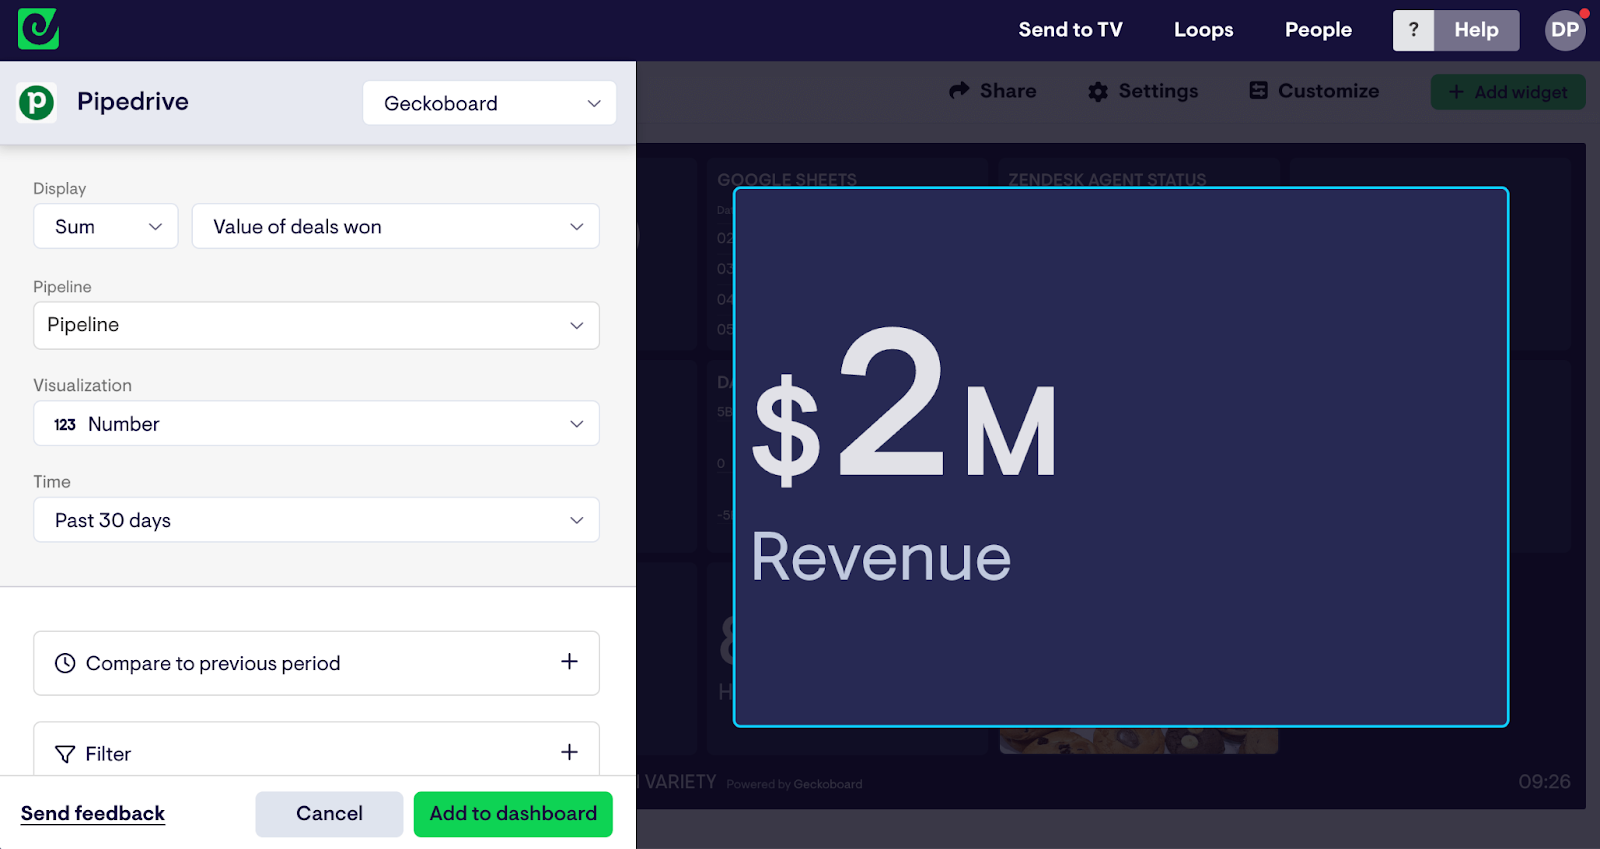
You can also add further context to your visualizations. For example, you might add a sales goal you are trying to reach, a comparison with a previous period. This helps the team quickly understand how to interpret the data on the dashboard.
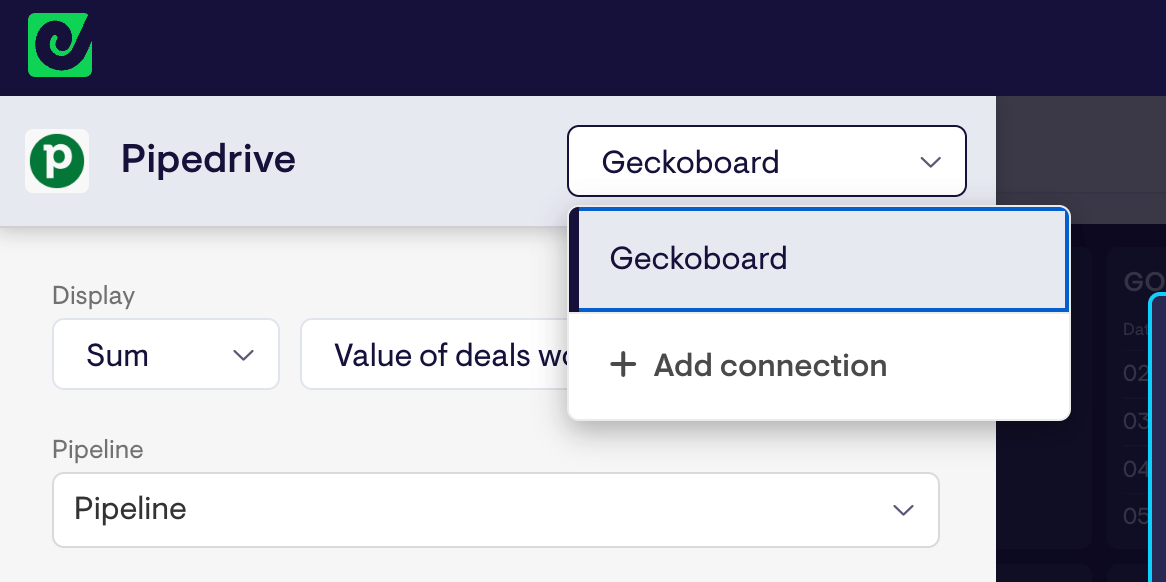
Step 3: Connect data from multiple Pipedrive accounts
When you add a widget, you’ll notice there is a dropdown at the top left hand side of the screen, here you can connect additional Pipedrive accounts. Just click the drop down and select Add connection.
Step 4: Build up your dashboard by adding more widgets
Continue adding widgets until you’ve visualized all your most important data from across your different accounts. You might complete the picture by including visualizations from other data sources such as Google Analytics, Google Ads, Facebook or Spreadsheets.
It’s easy to move, resize and group widgets using Geckoboard – it's just a case of "drag and drop". And if you want to change the color scheme, just click on the customize menu to create a custom theme like the one we’ve created below.

Conclusion
And there you go. Now you can see all your Pipedrive metrics in one place. No more spending all your time logging into different accounts.
