If you use Zendesk, you will likely have come across Zendesk's native reporting and analytics tool, Zendesk Explore. This allows you to create custom views of the metrics in your Zendesk account.
But what if you want to create reports and dashboards that visualize data from multiple Zendesk accounts? Sadly, this is not possible in Zendesk Explore.
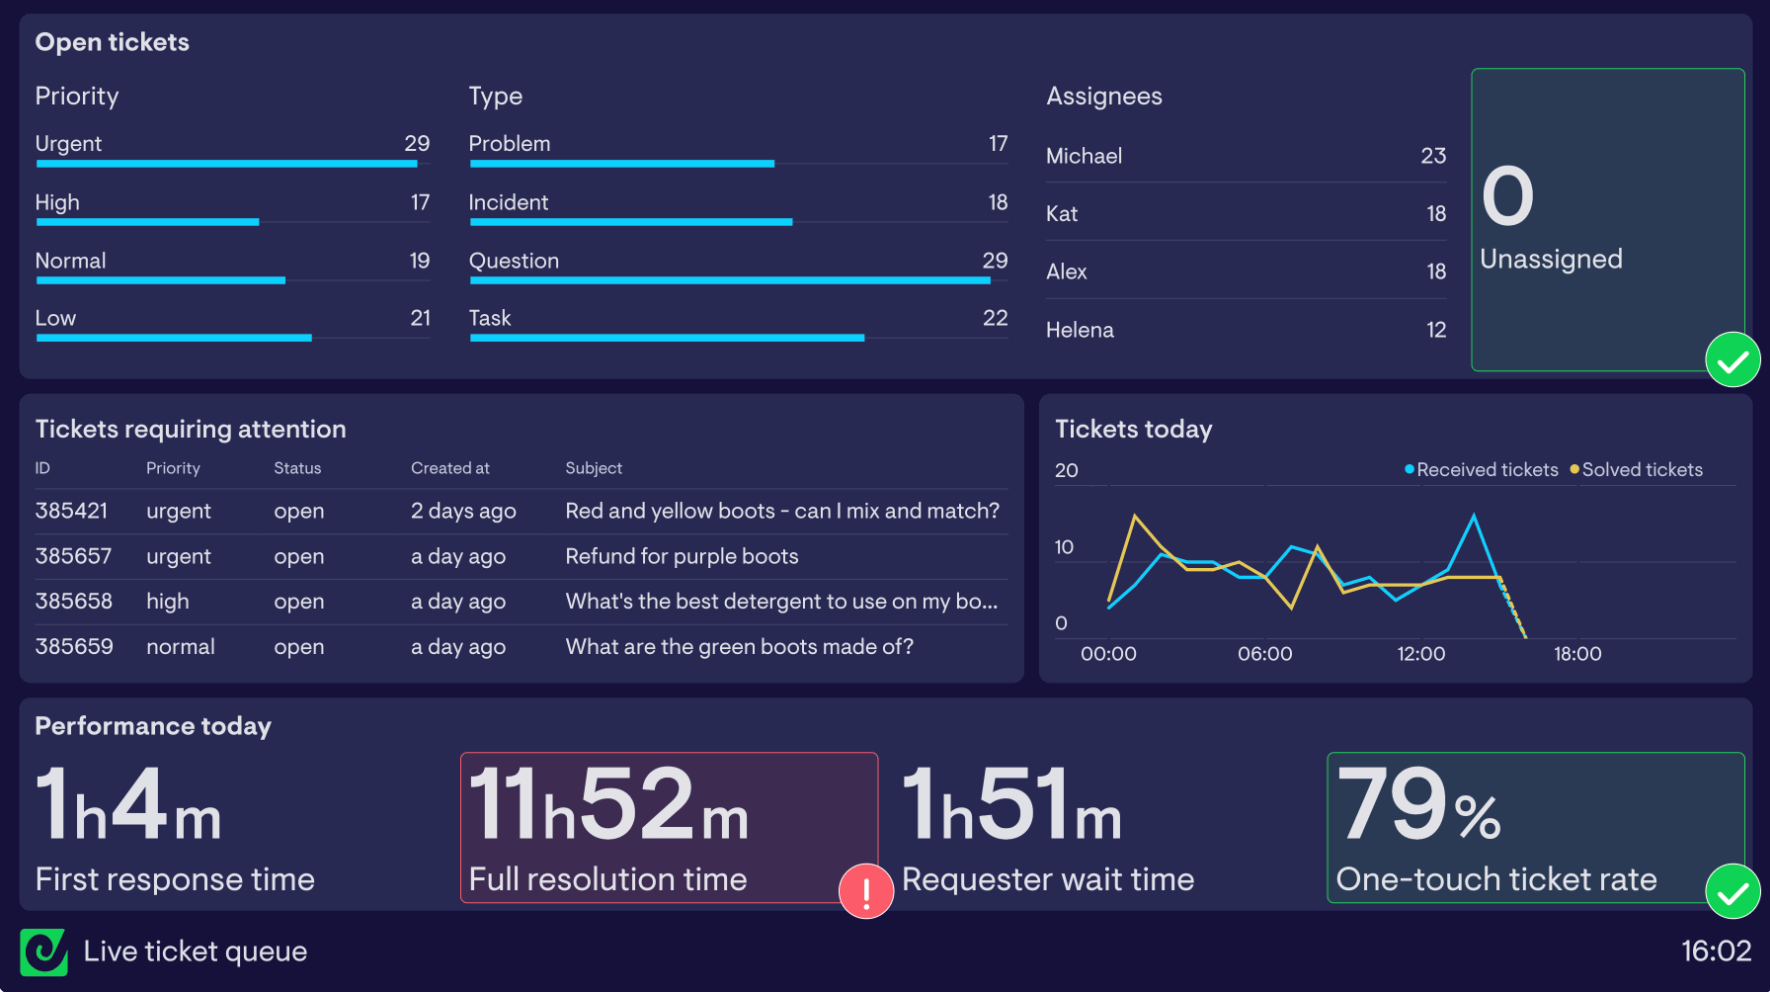
Fortunately, it is possible to visualise data from several Zendesk instances in Geckoboard. In this article we’ll explore how you can use Geckoboard to visualize metrics from several Zendesk accounts in a single dashboard.
Why might you need to report on multiple Zendesk instances?
There are several reasons why you might need to report on more than one Zendesk account simultaneously.
- You’re a Zendesk consultant or implementor, and you want to monitor several clients’ Zendesk metrics at once.
- You own more than one business and want to keep tabs on Support KPIs from both of your businesses, in the same dashboard
- You run several brands within the same business. And these are operationally separate, with different accounts.
If you find yourself in one of these situations, you might already find the only way to keep track of your metrics is to continually log in and out of your different accounts. Fortunately, there is another way.
How to report on multiple accounts with Geckoboard
In the same way you can use Geckoboard to create a KPI dashboard that visualizes data from multiple sources (such as HubSpot, LinkedIn, Salesforce and Google Analytics) – you can also use Geckoboard to create dashboards that visualize data from multiple accounts within the same data source.
That means you can easily create a custom dashboard, which gives you all the data you need in one place. Geckoboard also auto-refreshes its data sources in real-time, so you know your metrics will always be up to date.
So let’s find out how you can build a multi-data source dashboard.
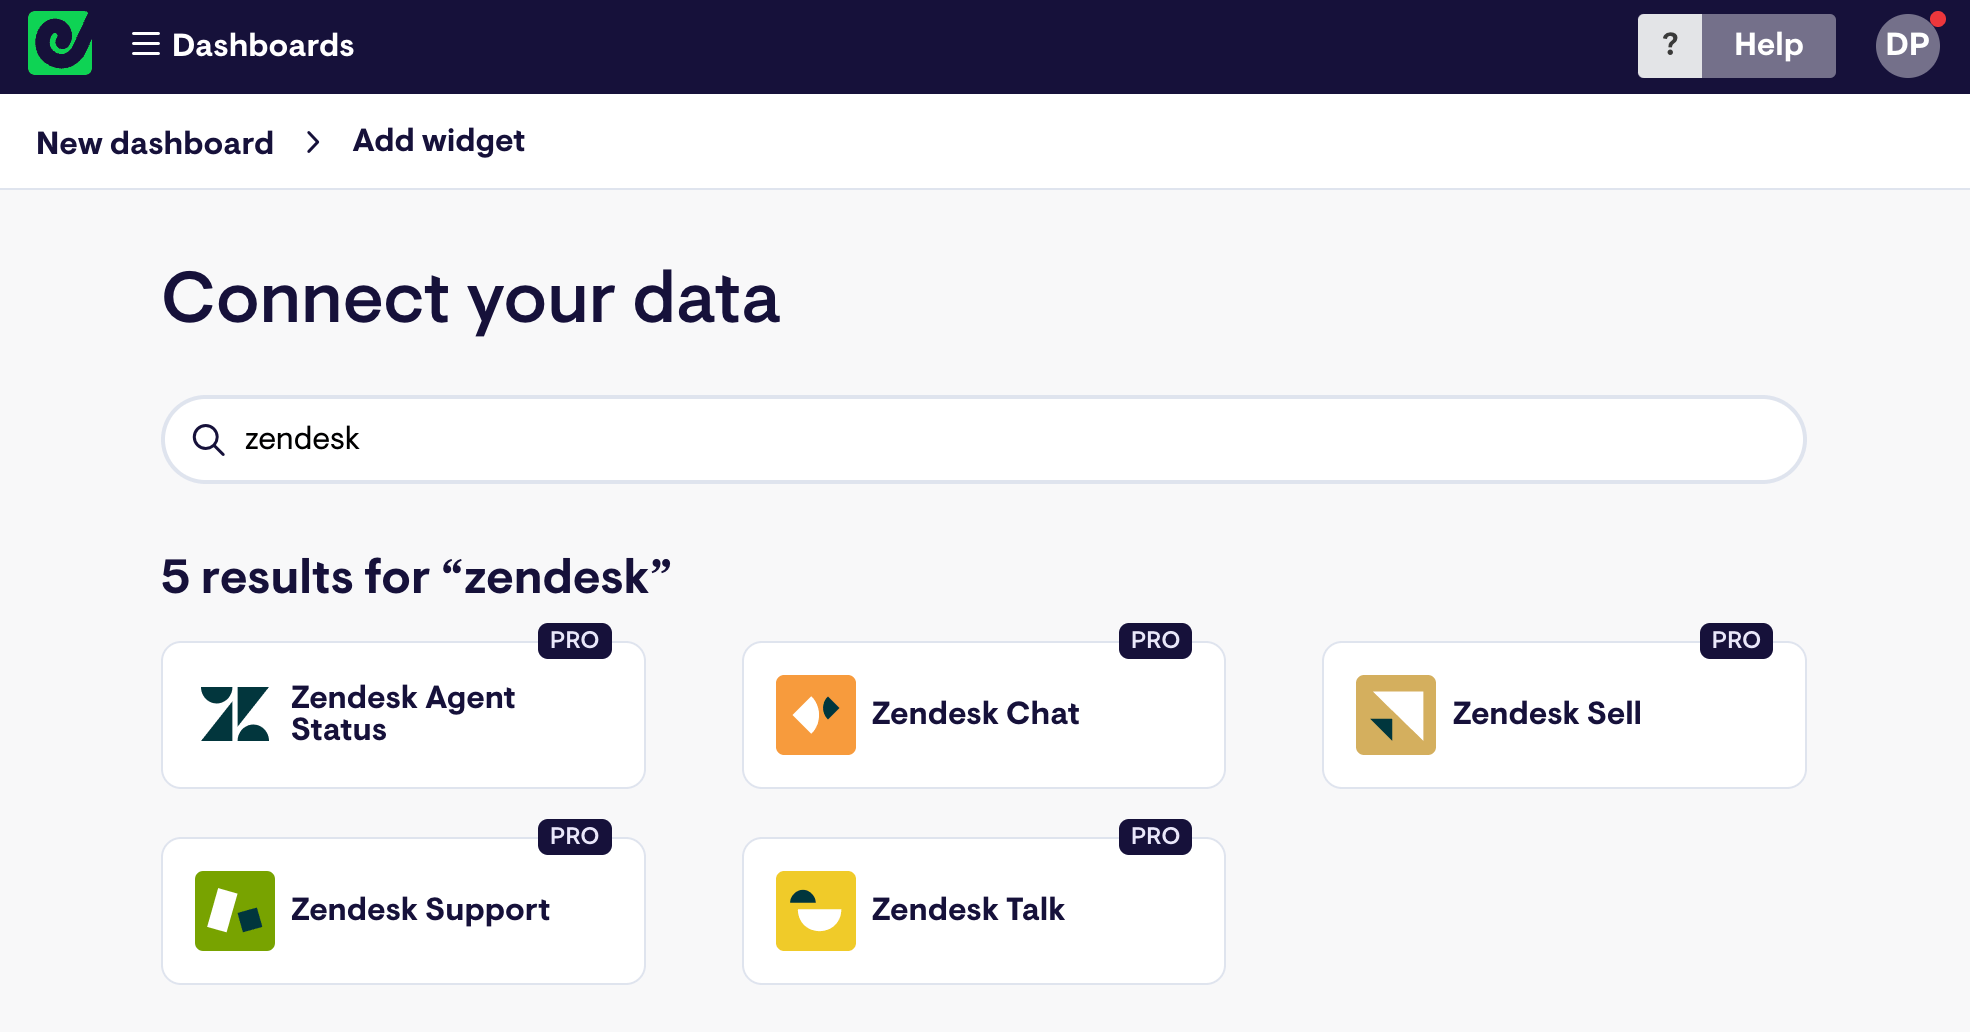
Step 1: Sign up to Geckoboard and connect Zendesk
Head to Geckoboard to sign up for a 14-day free trial. Next, start building your dashboard selecting one of the Zendesk data sources.
Step 2: Build a widget with Zendesk data
Now you’ve connected Zendesk, you can build your first widget. A widget is just a type of data visualization – you can choose numbers, line charts, leaderboard, funnels or gauges.
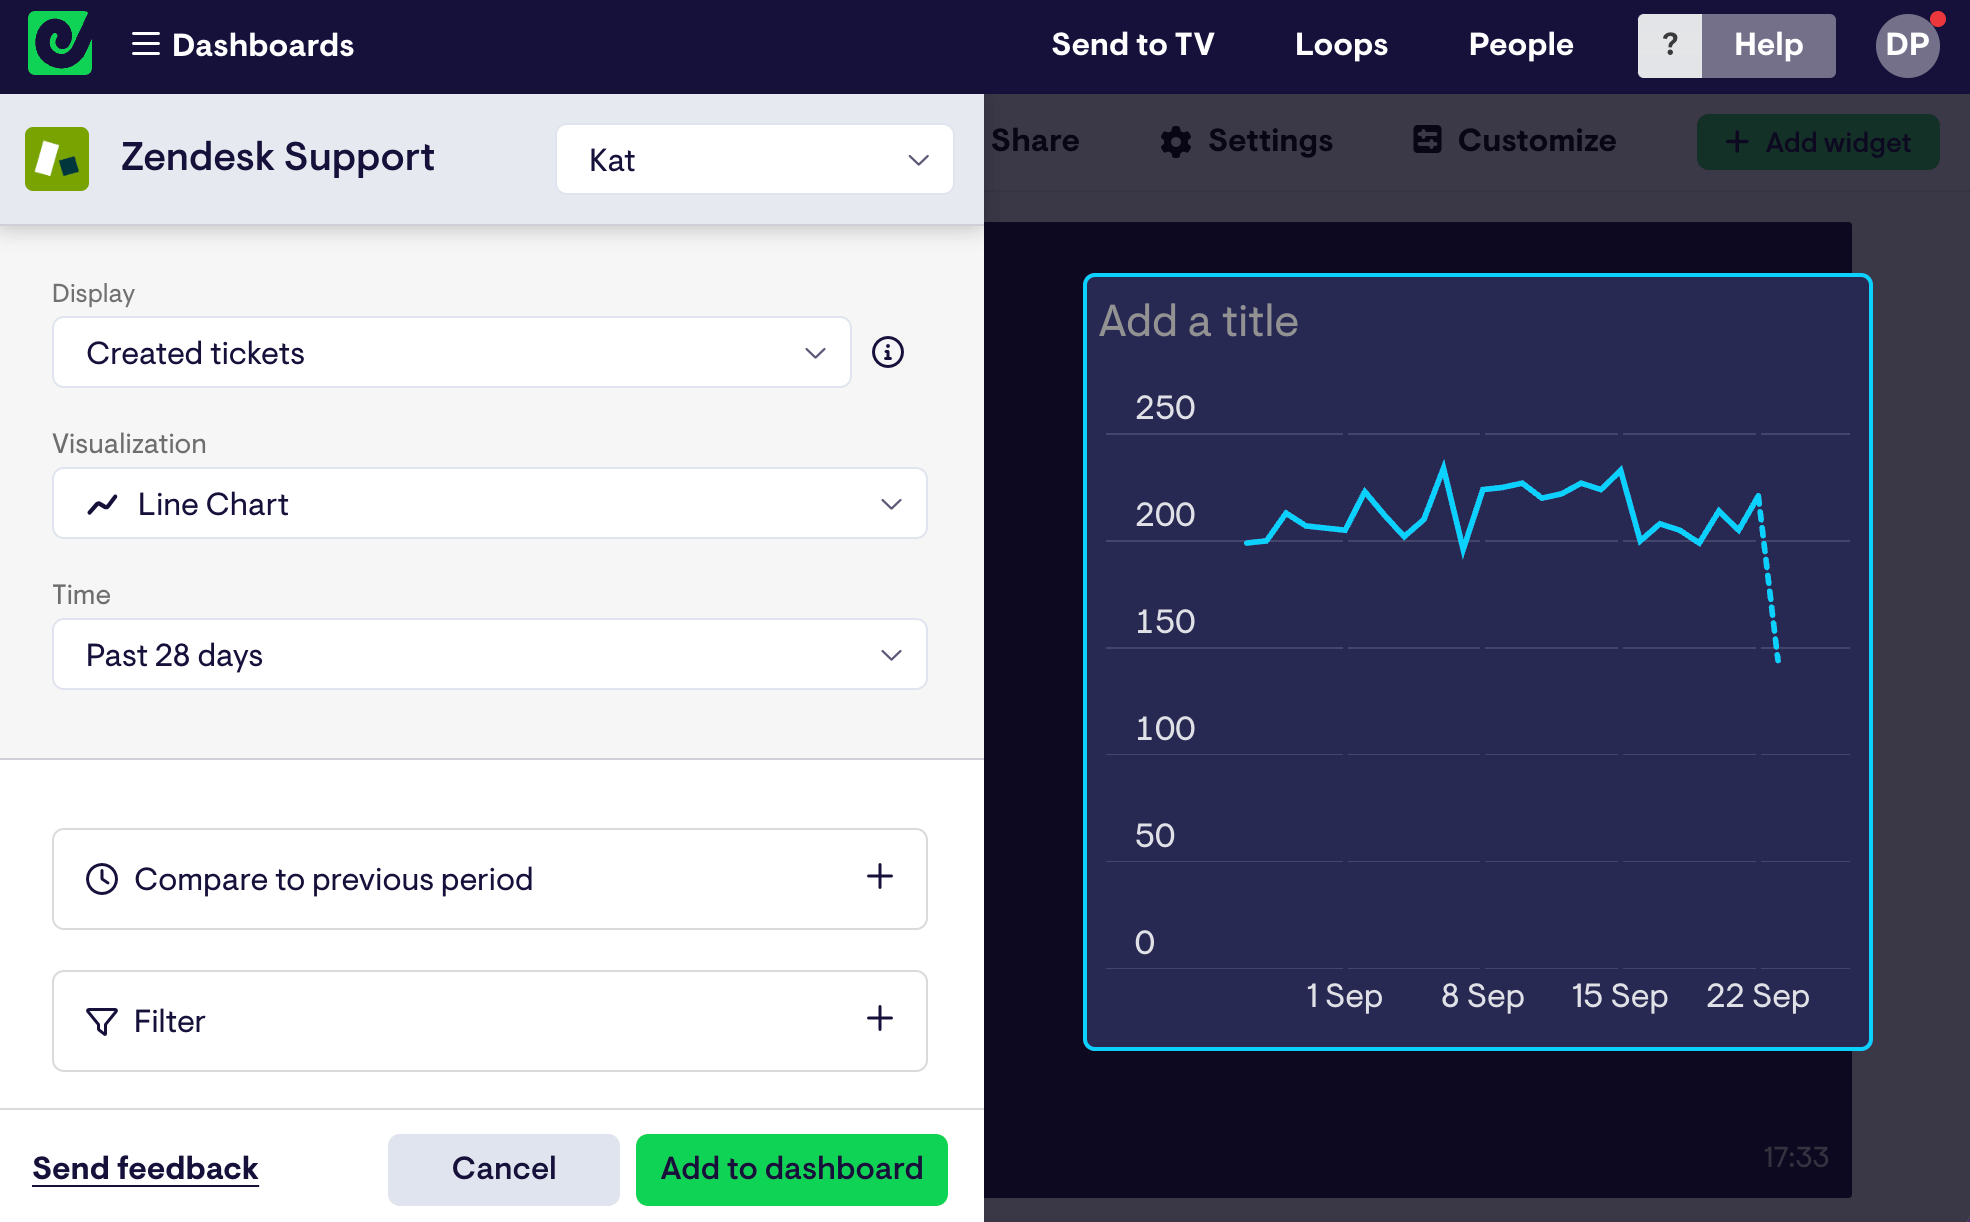
You can also add further context to your widgets. For example, you might add a status indicator to alert you when you are not meeting your SLAs. This helps your team quickly understand how to interpret the data on the dashboard, and take action.
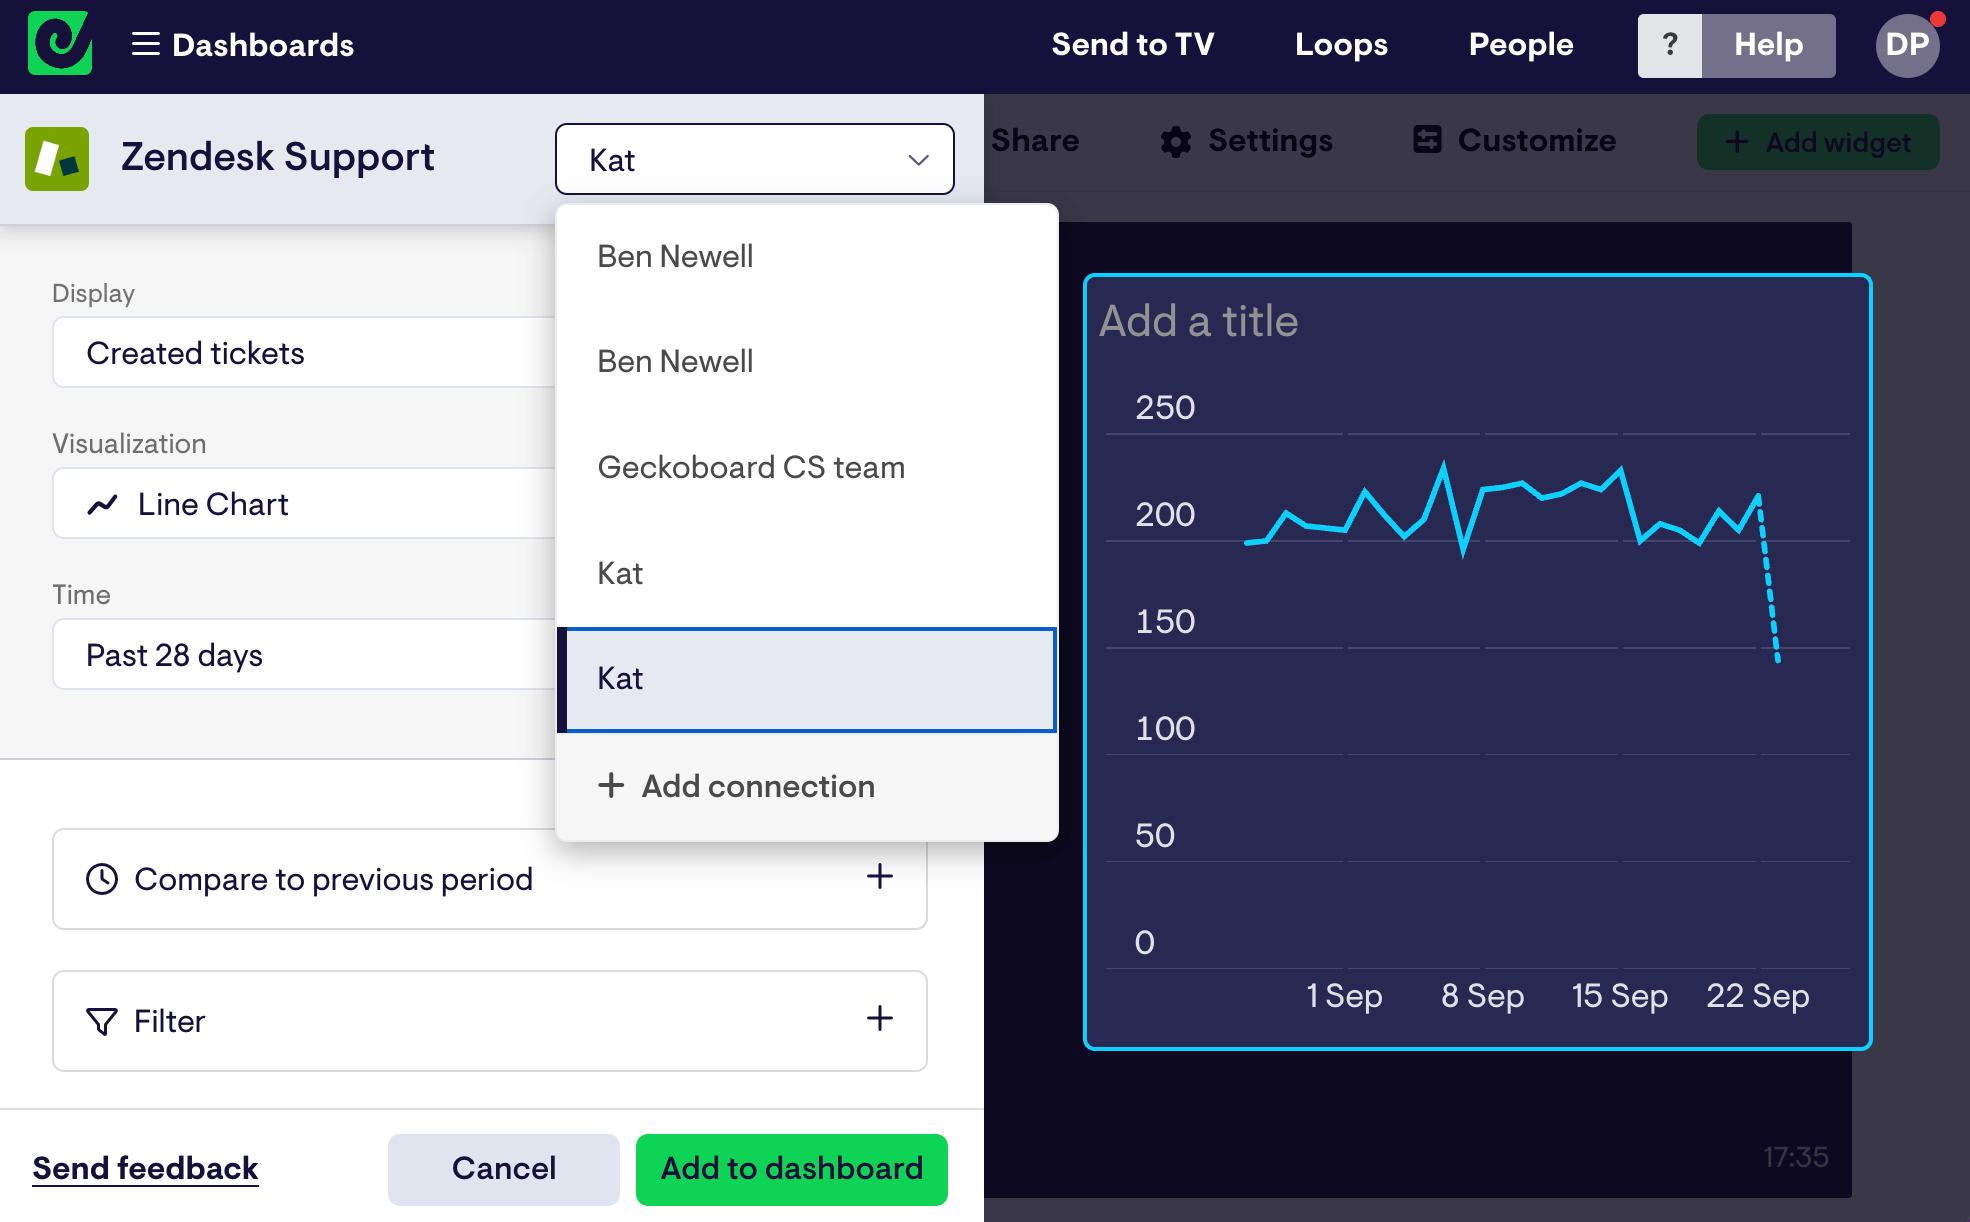
Step 3: Connect data from multiple Zendesk accounts
When you add a widget, you’ll notice there is a dropdown at the top left hand side of the screen where you can connect additional Zendesk connections. Just click the drop down and select 'Add connection'.
Step 4: Complete your dashboard by adding more widgets
Continue adding widgets until you’ve visualized all your most important data from across your different accounts. You might complete the picture by including visualizations from other data sources such as Aircall, Jira, Facebook, or Spreadsheets.
Conclusion
There we have it. Now you can see all your Zendesk data in one place. No more wasting time logging into different accounts.
