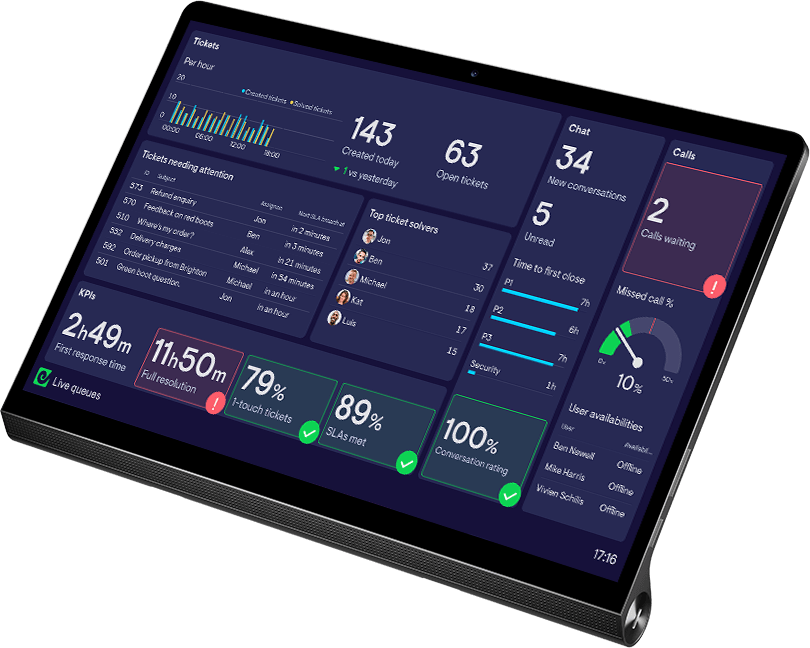
Interactive View
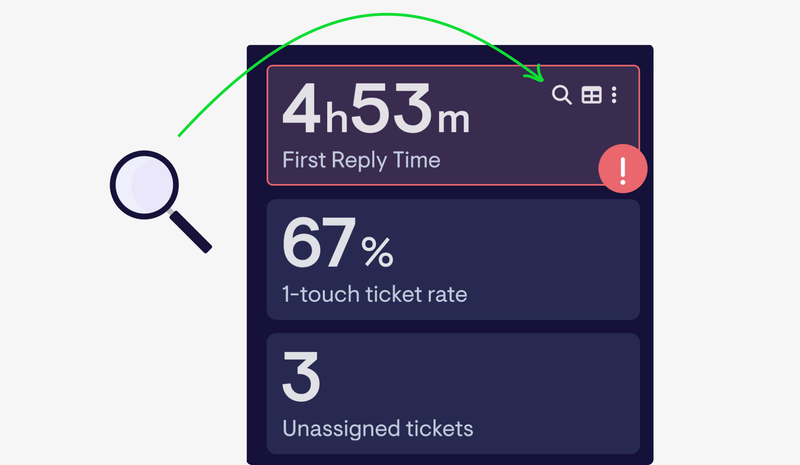
When important metrics change, use Interactive View to drill down deeper, and quickly understand why.
A faster way to query your KPIs
Geckoboard dashboards show you when a metric changes. Interactive View reveals why — explore the underlying trends without leaving Geckoboard or running complex queries.


We operate on a marketing and sales service level agreement. The dashboards I have in Geckoboard really cleanly give us a picture on any given day of whether everyone is upholding that agreement and where the cracks are.
90+ data sources
Raise awareness of key metrics by making KPIs easy to access and understand, wherever they’re stored.


Plus 90+ other tools
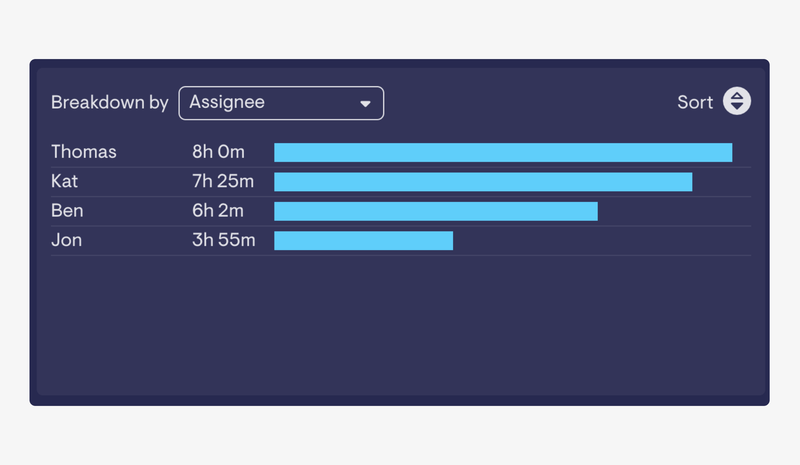
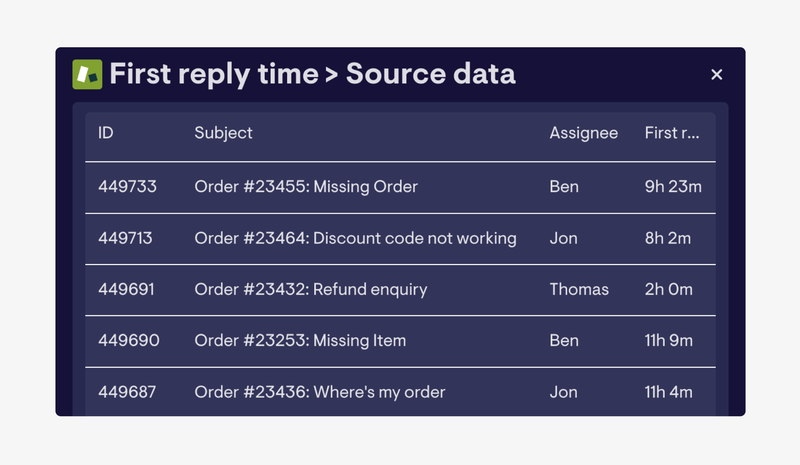
Interactive View in action
See how Support teams can monitor service levels more efficiently, by using Interactive View to investigate which support tickets are affecting your KPIs.
Dashboard admins, and view-only users who have been given Explorer privileges.
Aircall, Facebook, Facebook Ads, Google Ads, Google Analytics 4, Google Search Console, HubSpot, Instagram Business, Intercom, LinkedIn, Matomo Cloud, Pipedrive, Shopify, Stripe, YouTube Analytics and Zendesk Support.
No. Explorations don’t permanently change your widgets, and they aren’t visible on TV or sharing links.
Interactive View is available on Pro plans and above. See our pricing for details.
Ready to get started?