Interactive View
When important metrics change, use Interactive View to drill down deeper, and quickly understand why.
A faster way to query your KPIs
Geckoboard dashboards have always shown you when your metrics change, now you can find out why they’ve changed. Don’t waste time with other reports or complex queries. Use Interactive View to explore underlying trends in just a few clicks.
-
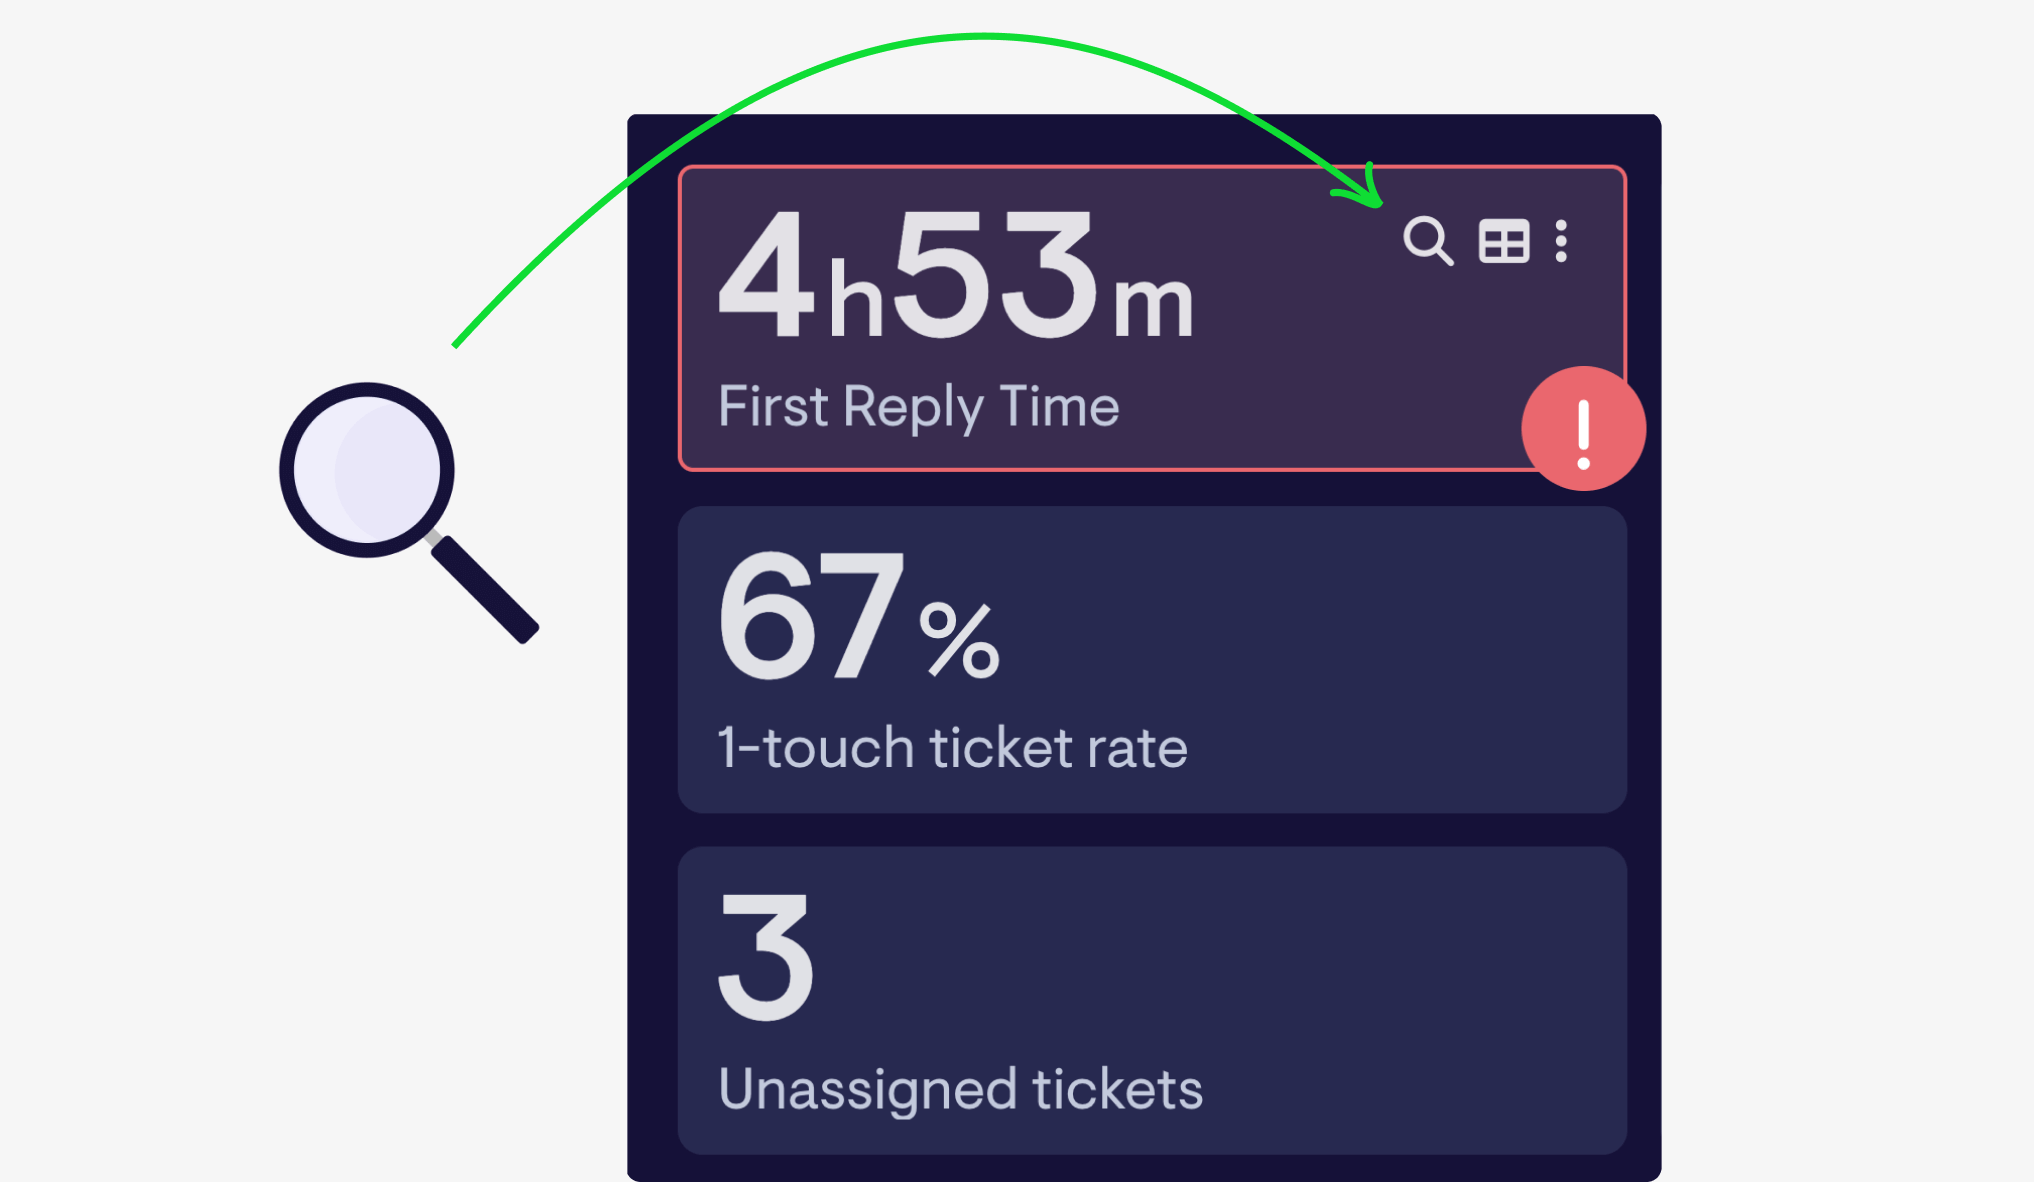
Diagnose problems
Spotted an issue developing with one of your metrics? Instantly investigate the root cause, so you can take action quickly.
-
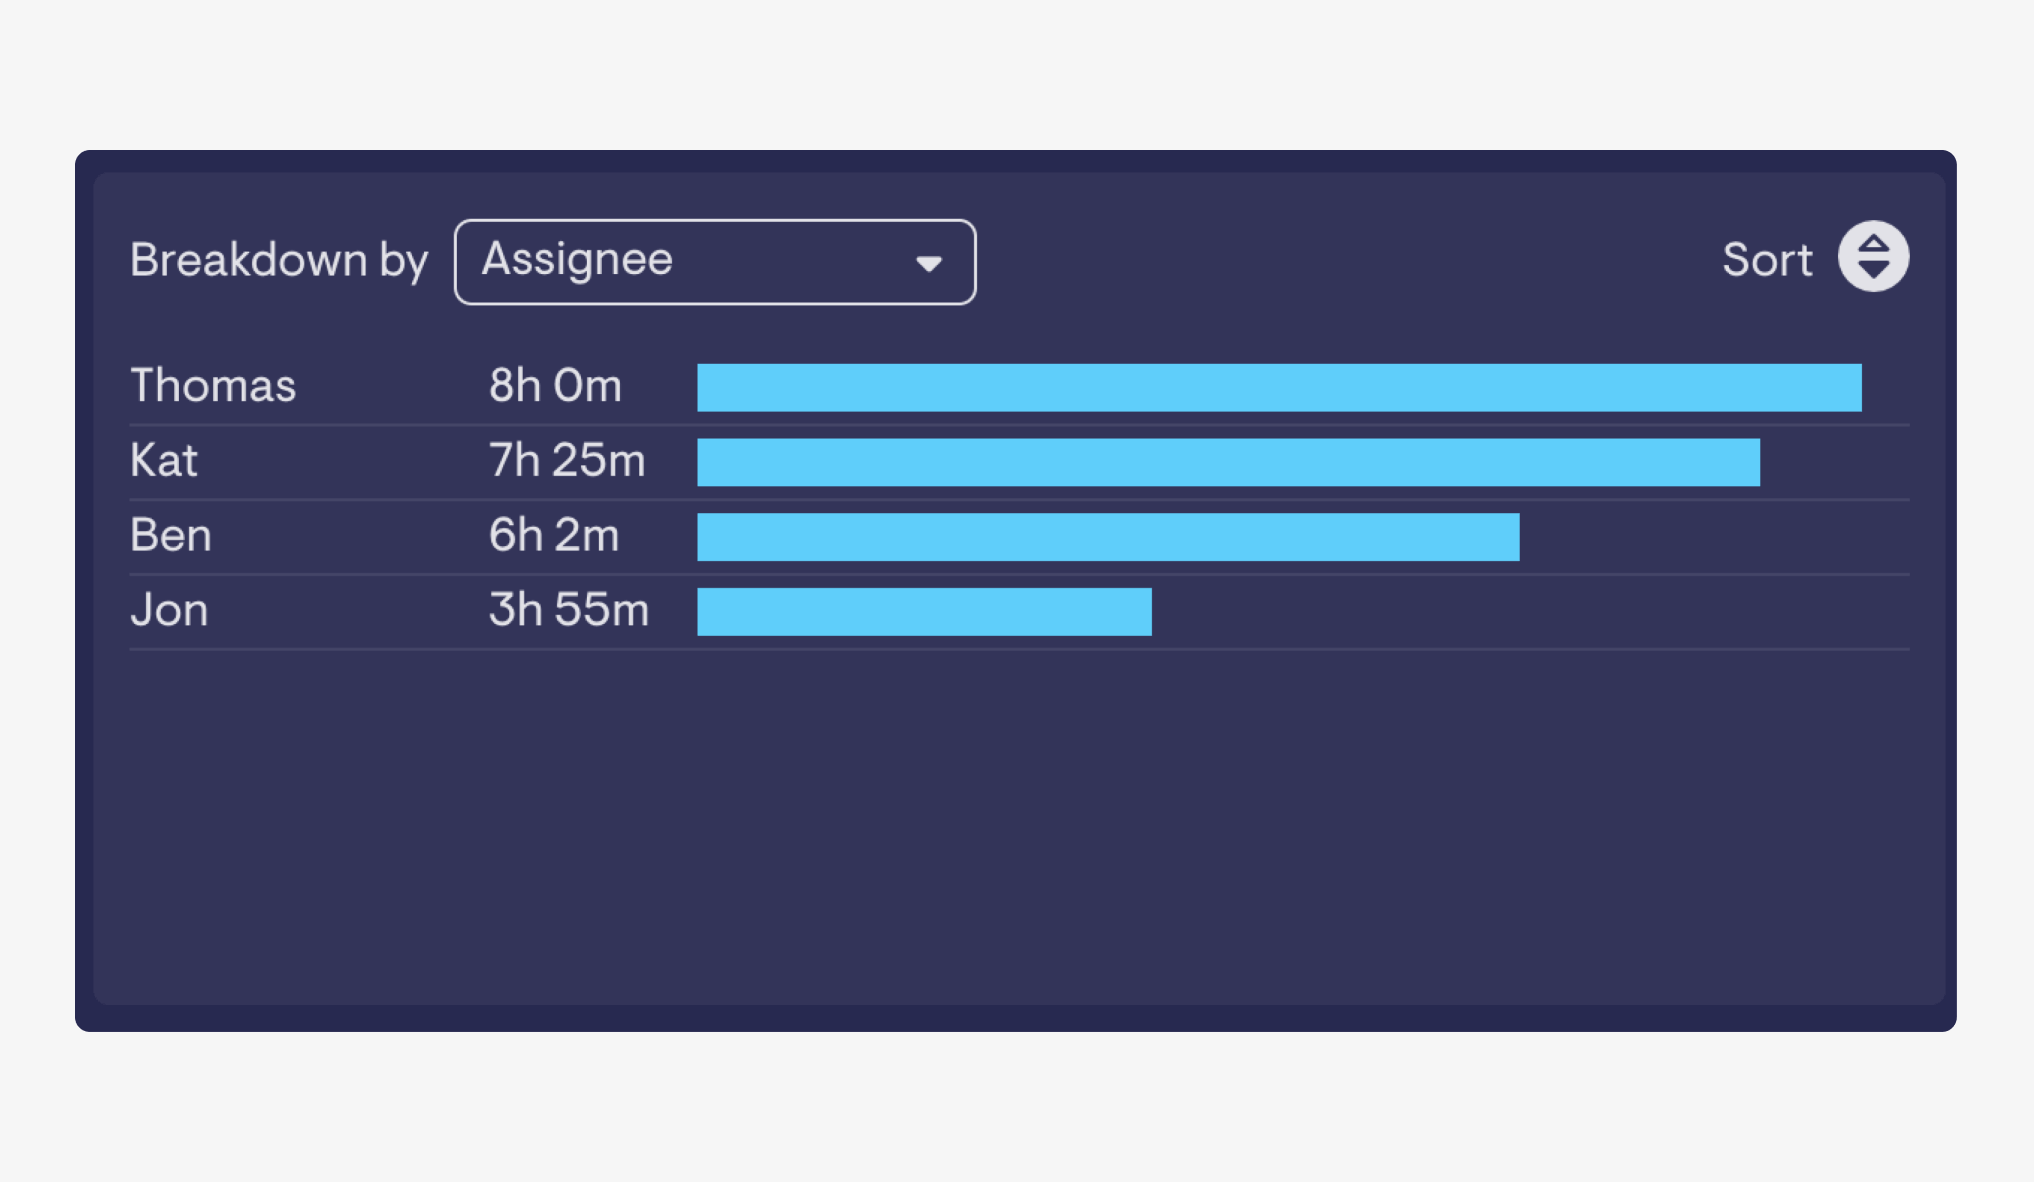
Break metrics down
Examine how your metric has changed over time, or break down performance according to different fields.
-
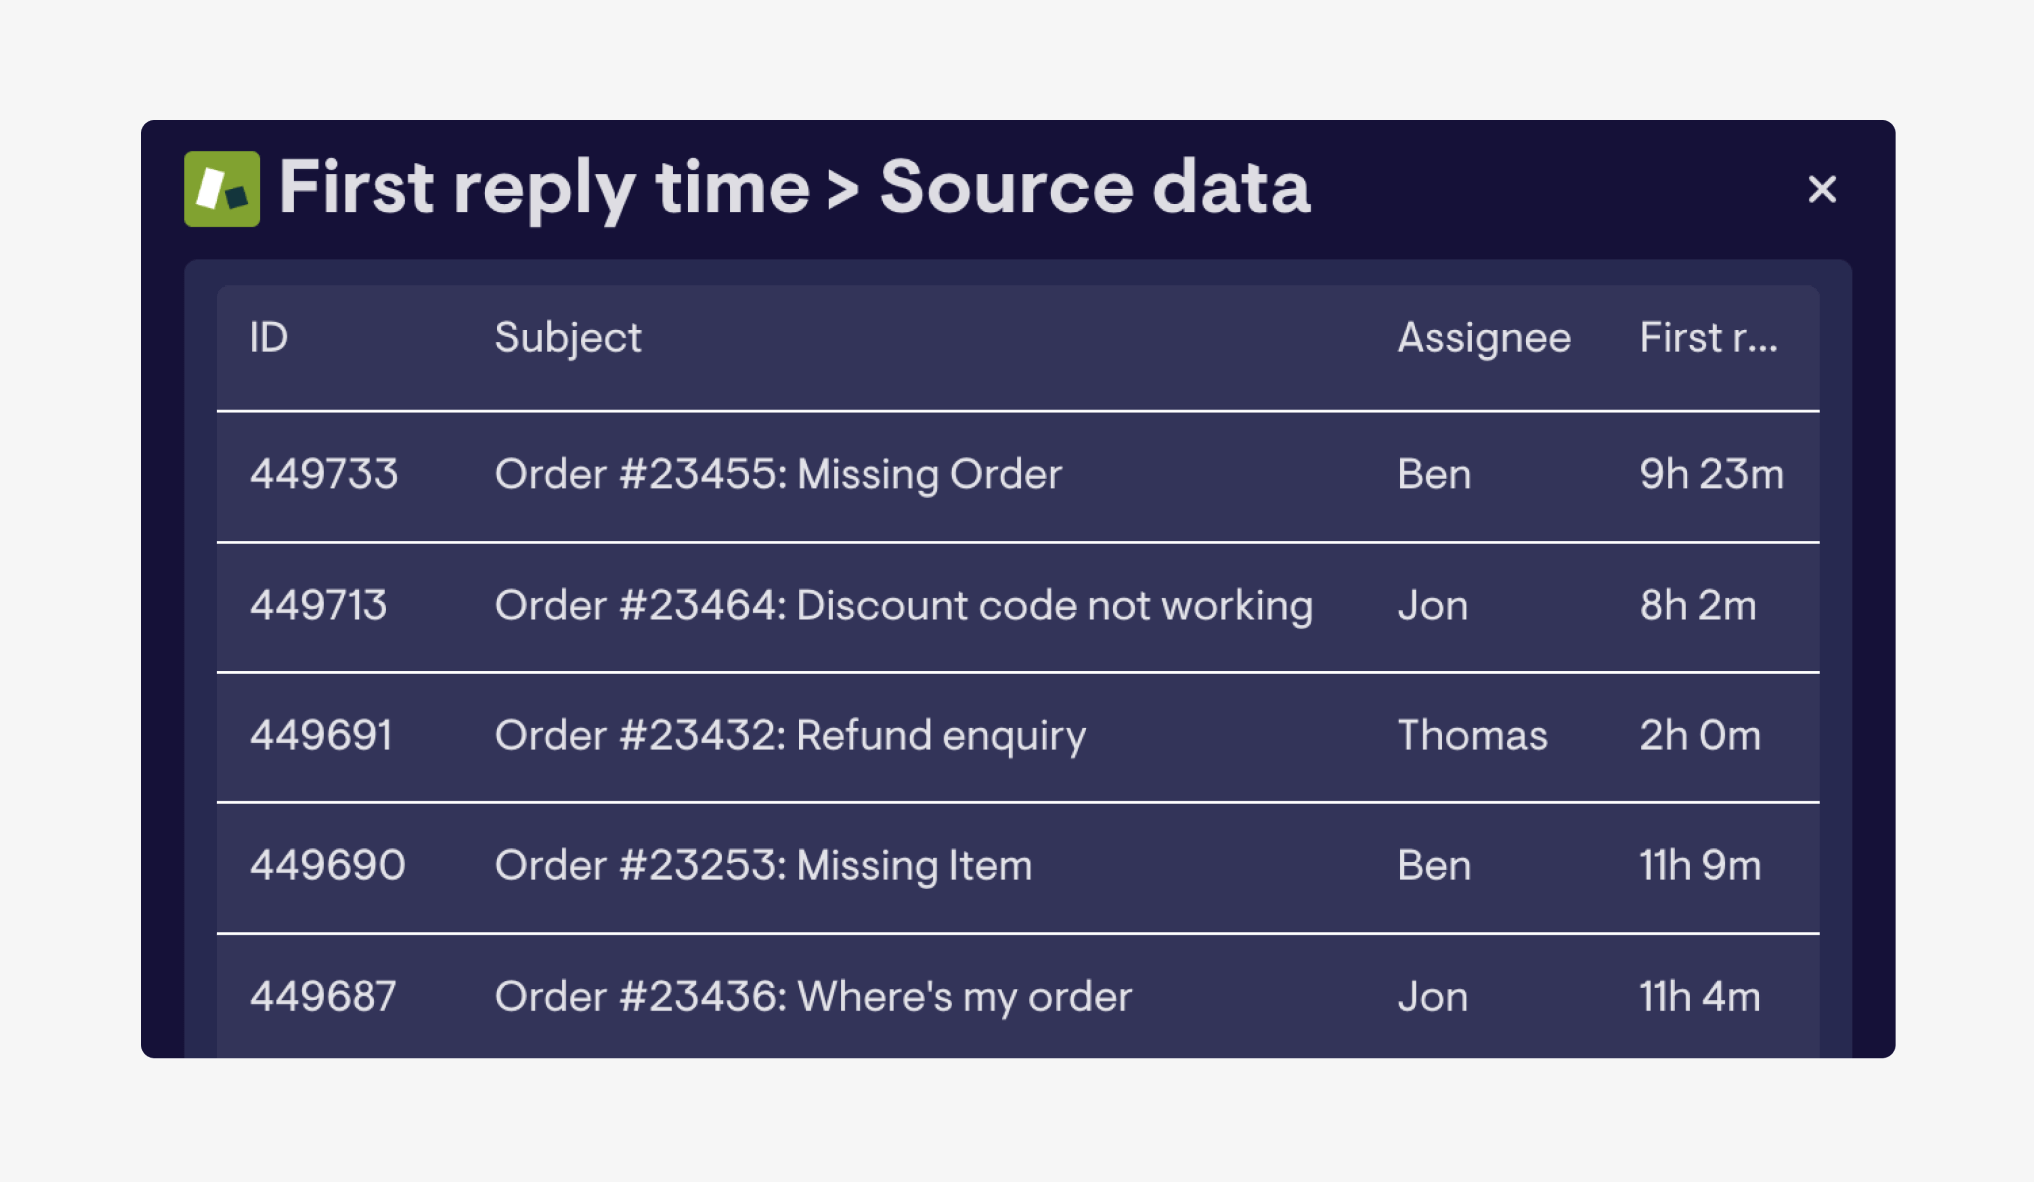
Go granular
Use Source Data to zone in on the exact support tickets, calls or orders affecting your metric. (Source Data is available for Zendesk Support, Aircall and Shopify)
Available on the following data sources
Interactive View is available on Pro plans or above, and can be used with the following data sources:


FAQ
Q&A
Who can access Interactive View?
Interactive View can be accessed by dashboard admins on your Geckoboard account, as well as view-only users who have been given Explorer privileges. Read more about user types here.
Which data sources support Interactive View?
Interactive View is available on some, but not all data sources. These include Aircall, Facebook, Facebook Ads, Google Ads, Google Analytics 4, Google Search Console, HubSpot, Instagram Business, Intercom, LinkedIn, Linkedin Ads, Matomo Cloud, Pipedrive, Shopify, Stripe, Youtube Analytics, Zendesk Agent Status, Zendesk Support (updated August 2025).
Does Interactive View impact my dashboards?
No. You can drill into time periods and break metrics down with filters as much as you need whilst Interactive View is open. None of this impacts the widgets on your dashboard permanently though, and when you’re done exploring, you can simply close it to return to your dashboard view. Your explorations will only be visible to you, and aren’t visible on TV or sharing links.
How much does it cost?
Interactive View is available on Pro plans and above. Check out our pricing here.