Added real-time Zendesk Messaging metrics
We’re excited to introduce a whole new set of real-time metrics for Zendesk Messaging — making it easier than ever to track conversations the moment they hit your queue and get picked up by agents.
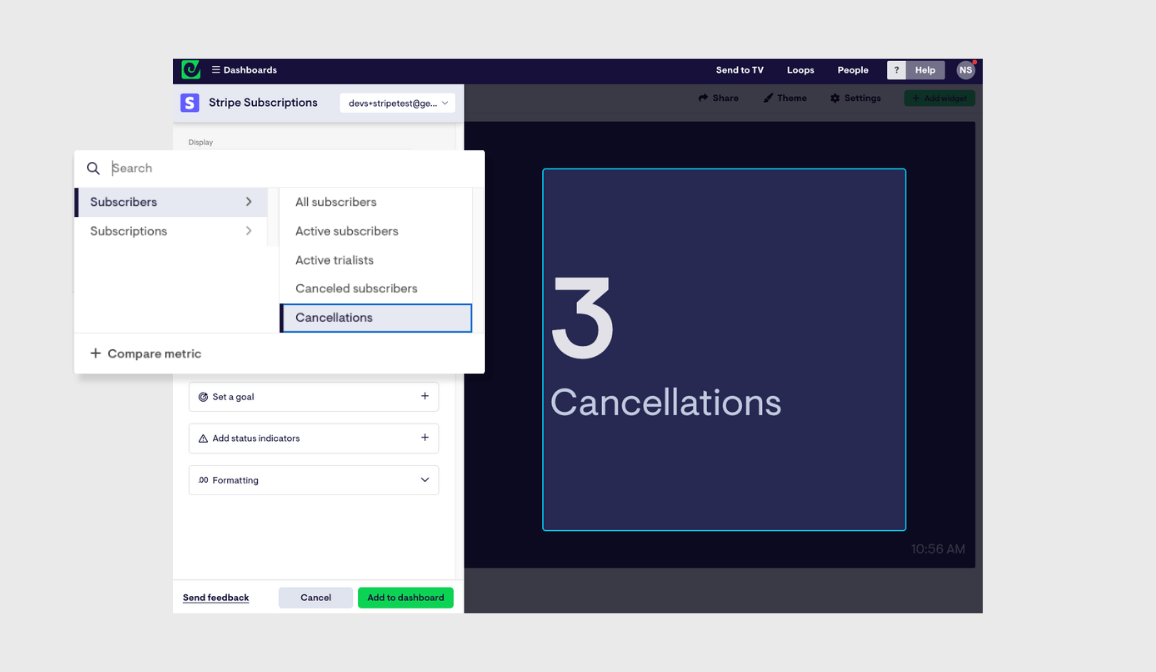
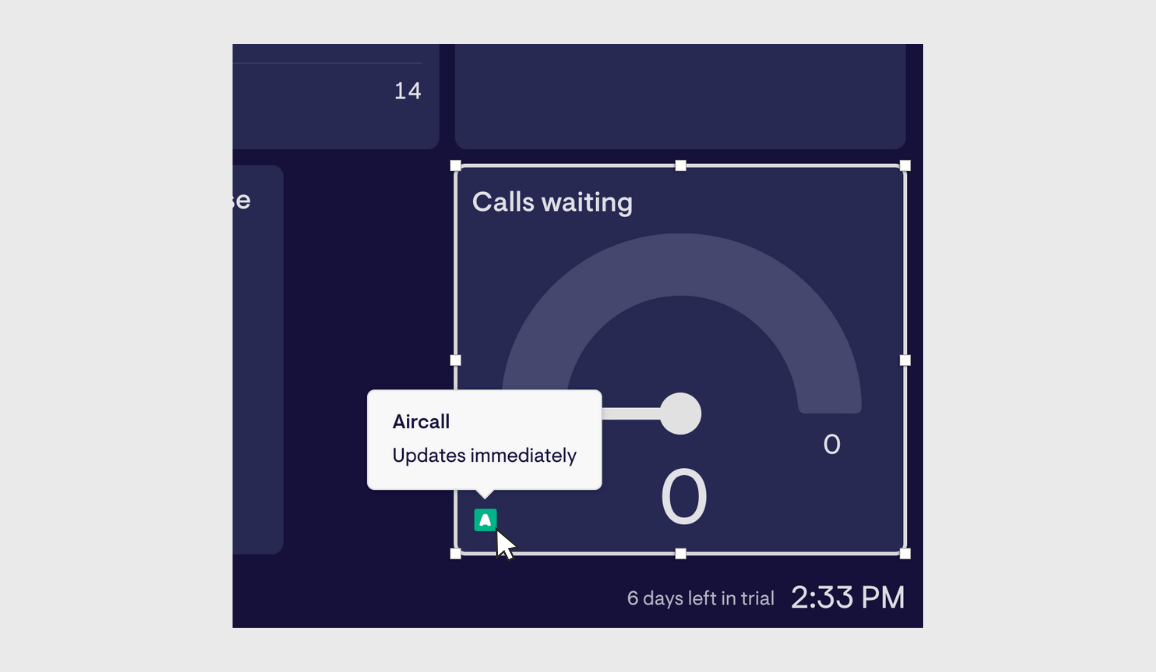
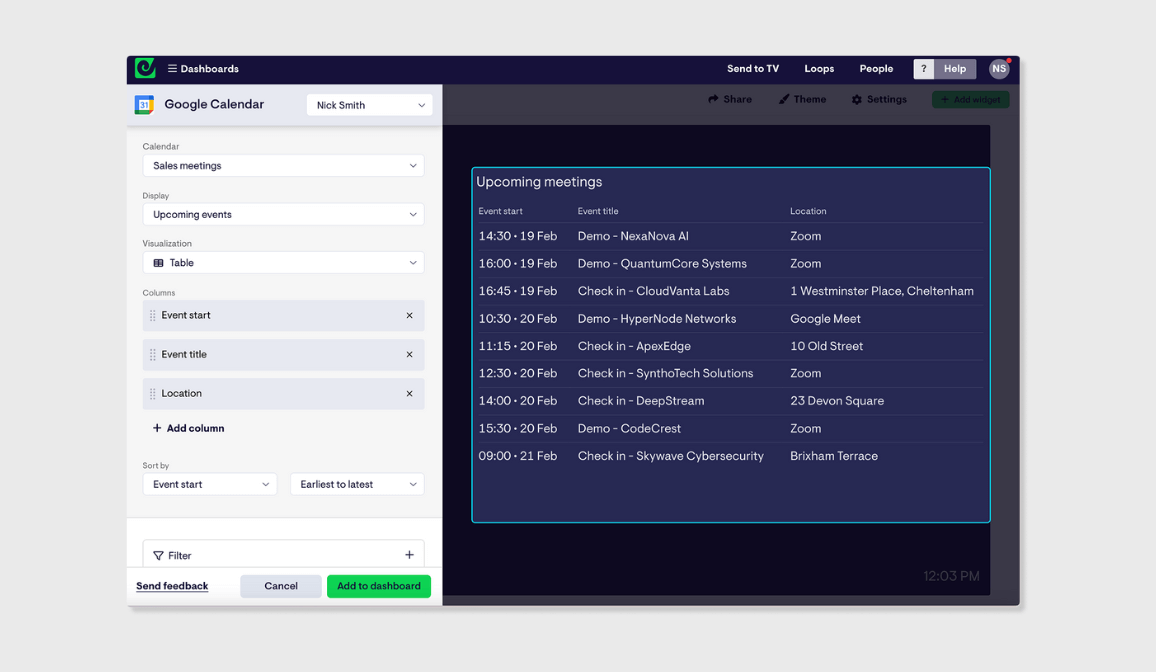
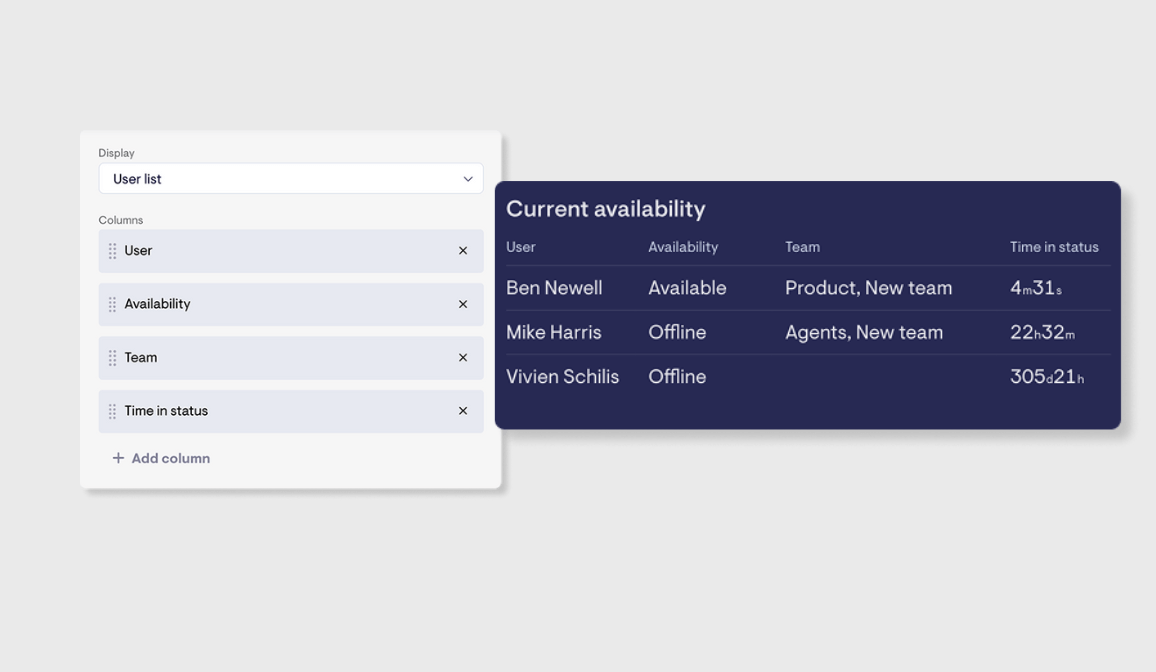
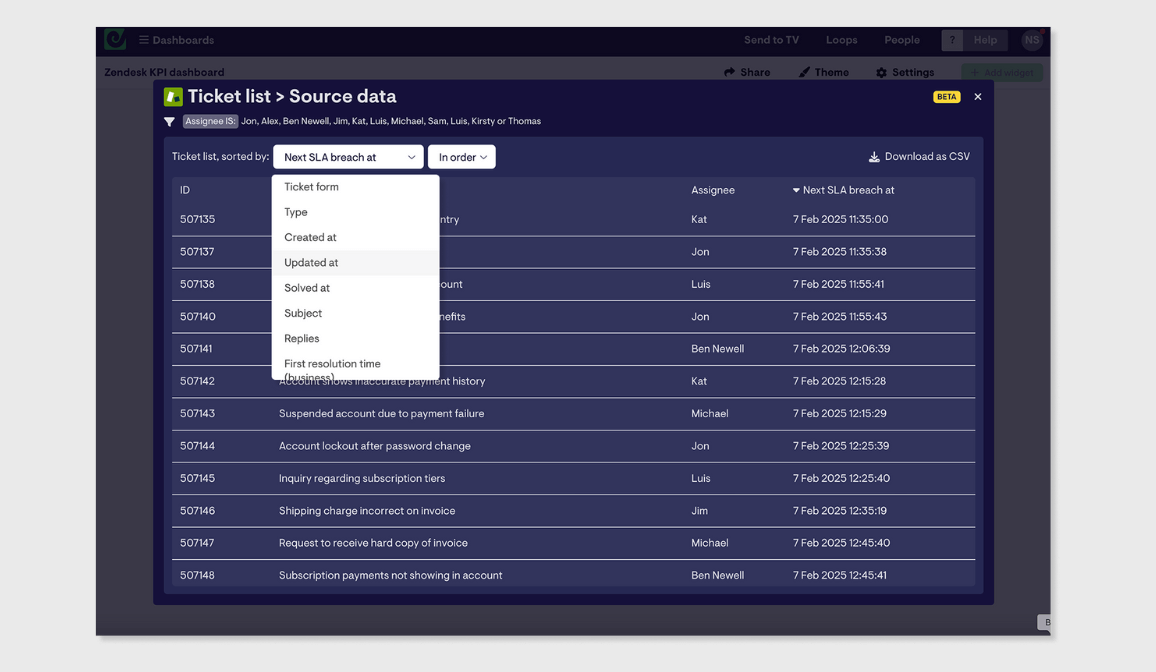
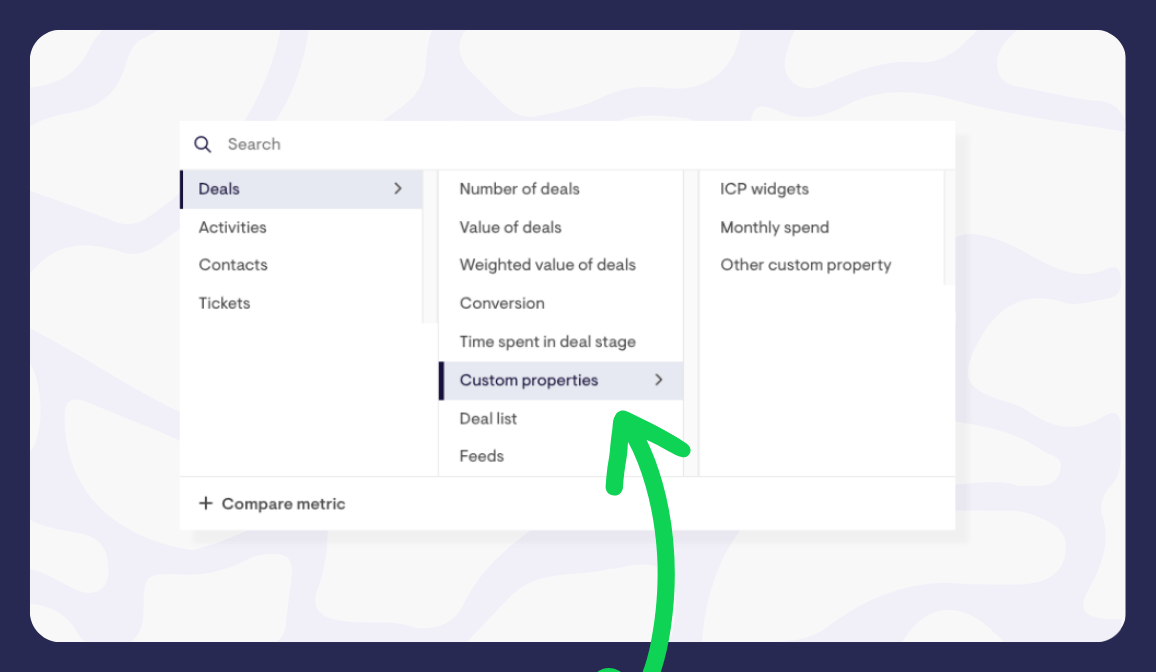
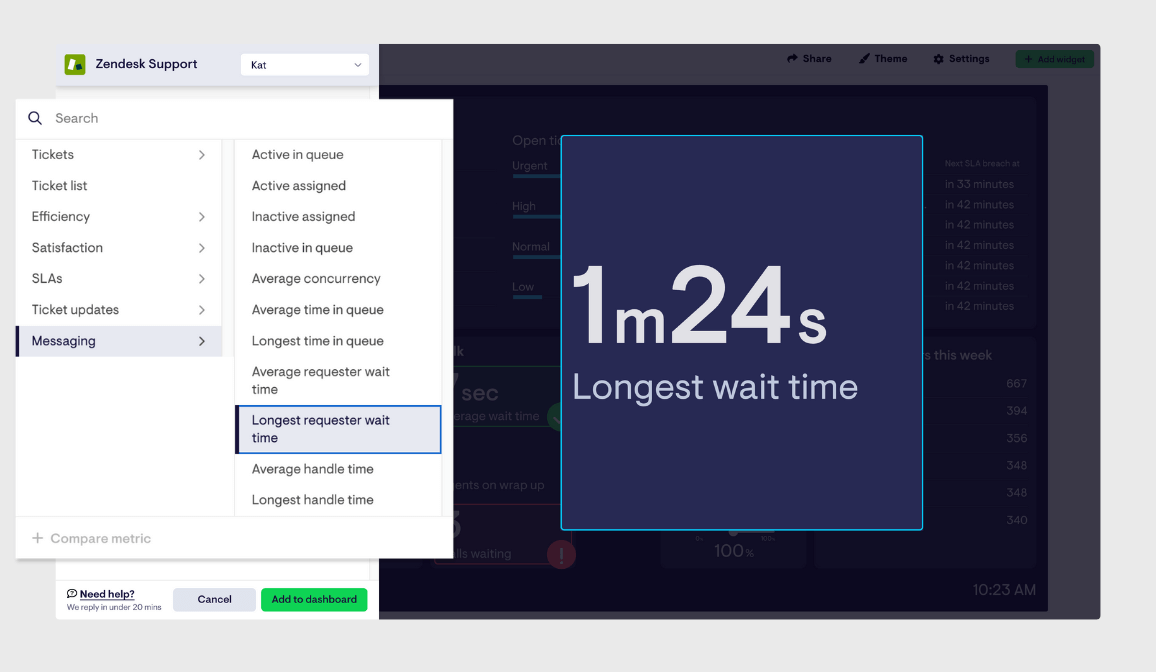
You’ll find these new metrics under the Messaging category in our Zendesk Support integration. From there, you can choose from a range of metrics that update in real time as conversations enter the queue.
Currently supported:
- Active conversations in queue
- Active assigned conversations
- Inactive assigned conversations
- Inactive conversations
- Average concurrency
- Average time in queue
- Longest time in queue
- Average requester wait time
- Longest requester wait time
- Average handle time
- Longest handle time
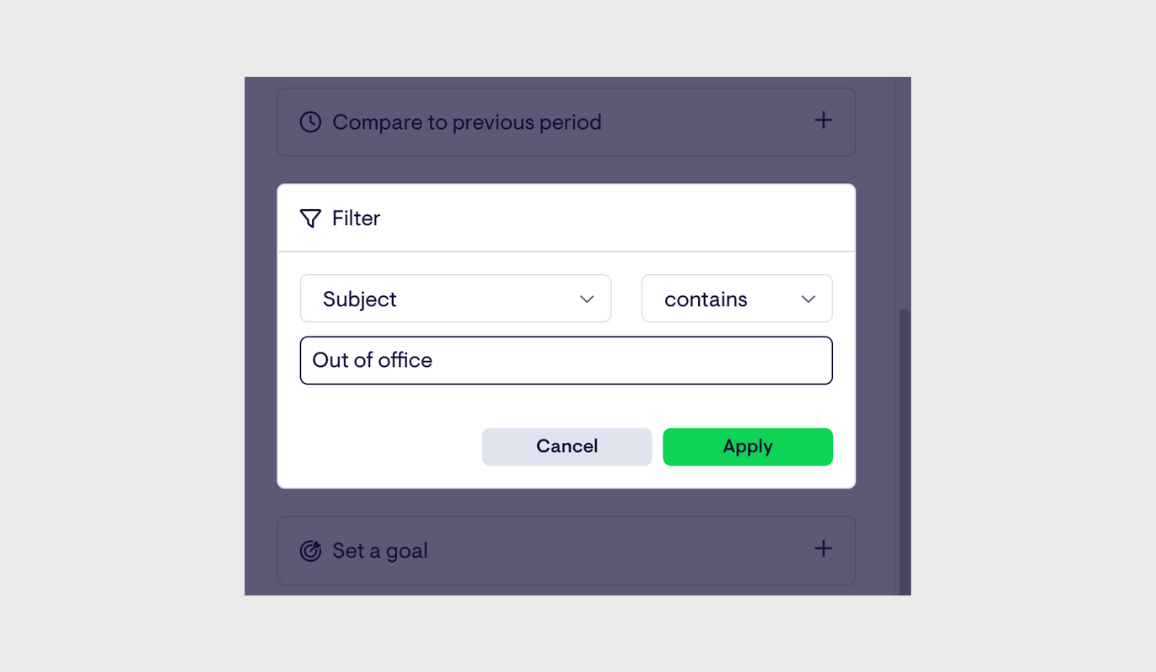
All metrics can be filtered by channel and group for deeper insights.
We’d love to hear your feedback or requests — get in touch!